- Collection:
- Office of Desegregation Management
- Title:
- Equitable allocation of resources
- Publisher:
- Little Rock, Ark. : Butler Center for Arkansas Studies. Central Arkansas Library System
- Date of Original:
- 1998/2000
- Subject:
- Little Rock (Ark.)--History--20th century
Little Rock School District
Education--Arkansas
Education--Evaluation
Educational statistics
School integration - Location:
- United States, 39.76, -98.5
United States, Arkansas, 34.75037, -92.50044
United States, Arkansas, Pulaski County, 34.76993, -92.3118
United States, Arkansas, Pulaski County, Little Rock, 34.74648, -92.28959 - Medium:
- documents (object genre)
- Type:
- Text
- Format:
- application/pdf
- Metadata URL:
- http://arstudies.contentdm.oclc.org/cdm/ref/collection/bcmss0837/id/435
- Language:
- eng
- Additional Rights Information:
- Available for use in research, teaching, and private study. Any other use requires permission from the Butler Center.
- Extent:
- 45 pages
- Original Collection:
- Office of Desegregation Monitoring records (BC.MSS.08.37)
History of Segregation and Integration of Arkansas's Educational System - Contributing Institution:
- Butler Center for Arkansas Studies
- Rights:
-

All Levels Correlations Pearson Correlation Sig. (2-tailed) N % African American Students TE. RATIO ST A. RATI SQ.FT % Teachers with MA +9 TURNOVER # Students COMPUTER EXPENDIT VOLUNTEE DONATION EQUITY2 % African American Students TE.RATIO STA.RATI SQ.FT % Teachers with MA +9 TURNOVER # Students COMPUTER EXPENDIT VOLUNTEE DONATION EQUITY2 % African American Students TE.RATIO STA.RATI SQ.FT % Teachers with MA +9 TURNOVER # Students COMPUTER EXPENDIT VOLUNTEE DONATION EQUITY2 % African American Students 1.000 -.325* -.376** .120 -.183 .274 -.257 .122 -.085 -.404** .269 -.137 .024 .008 .417 .213 .059 .078 .408 .565 .004 .065 .352 48 48 48 48 48 48 48 48 48 48 48 48 TE. RATIO STA.RATI SQ.FT % Teachers with MA +9 TURNOVER # Students -.325* -.376** .120 -.183 .274 -.257 1.000 .826** -.554** .826** 1.000 -.455** -.554** -.455** 1.000 .468** .407** -.252 -.285* -.365* .241 .135 .453* .170 .468** .407** -.252 1.000 -.131 .020 -.285* .135 -.265 -.522** -.071 -.152 -.497** -.365* .453** -.226 -.561** -.135 -.239 -.552** .241 .170 .135 .281 -.056 .066 .435** -.131 .020 -.158 -.282 -.017 -.190 -.036 1.000 -.068 -.197 .149 -.061 .258 -.047 -.068 1.000 .088 -.091 -.133 -.222 -.038 .024 .008 .000 .417 .213 .059 .078 .000 .000 .000 .001 .001 .001 .004 .083 .049 .011 .099 .359 .001 .248 .001 .004 .083 .376 .892 .049 .359 .069 .000 .630 .302 .000 .011 .001 .122 .000 .362 .103 .000 .099 .248 .361 .053 .706 .657 .002 .376 .892 .284 .052 .909 .197 .806 .644 .180 .311 .682 .077 .751 48 48 48 48 48 48 48 48 48 48 48 48 48 48 48 48 48 48 48 48 48 48 48 48 48 48 48 48 48 48 48 48 48 48 48 48 48 48 .644 .553 .536 .368 .129 .798 48 48 48 48 48 48 48 48 48 48 48 48 48 48 48 48 48 48 48 48 48 48 48 48 48 48 48 48 48 48 48 48 48 48 Page 6All Levels Correlations COMPUTER EXPEND IT VOLUNTEE DONATION EQUITY? Pearson Correlation Sig. (2-tailed) N % African American Students TE. RATIO STA.RATI SQ.FT % Teachers with MA +9 TURNOVER # Students COMPUTER EXPENDIT VOLUNTEE DONATION EQUITY2 % African American Students TE. RATIO STA.RATI SQ.FT % T eachers with MA +9 TURNOVER # Students COMPUTER EXPENDIT VOLUNTEE DONATION EQUITY2 % African American Students TE.RATIO STA.RATI SQ.FT % Teachers with MA +9 TURNOVER # Students COMPUTER EXPENDIT VOLUNTEE DONATION EQUITY2 .122 -.085 -.404** .269 -.137 -.265 -.226 .135 -.158 -.197 .088 1.000 .429** .175 -.046 .498** .408 .069 .122 .361 .284 .180 .553 .002 .235 .758 .000 48 48 48 48 48 48 48 48 48 48 48 48 -.522** -.561** .281 -.282 .149 -.091 .429** 1.000 .512 .195 .726** .565 .000 .000 .053 .052 .311 .536 .002 .000 .185 .000 48 48 48 48 48 48 48 48 48 48 48 48 *. Correlation is significant at the 0.05 level (2-tailed). -.071 -.135 -.056 -.017 -.061 -.133 .175 .512** 1.000 .020 .502** .004 .630 .362 .706 .909 .682 .368 .235 .000 .894 .000 48 48 48 48 48 48 48 48 48 48 48 48 -.152 -.239 .066 -.190 .258 -.222 -.046 .195 .020 1.000 .228 .065 .302 .103 .657 .197 .077 .129 .758 .185 .894 .118 48 48 48 48 48 48 48 48 48 48 48 48 -.497* -.552* .435*' -.036 -.047 -.038 .498* .726* .502* .228 1.000 .352 .000 .000 .002 .806 .751 .798 .000 .000 .000 .118 48 48 48 48 48 48 48 48 48 48 48 48 Page 7High School Correlations Pearson Correlation Sig. (2-tailed) N % African American Students TE. RATIO STA.RATI SQ.FT % Teachers with MA +9 TURNOVER # Students COMPUTER EXPENDIT VOLUNTEE DONATION EQUITY2 % African American Students TE. RATIO STARATI SQ.FT % Teachers with MA +9 TURNOVER # Students COMPUTER EXPENDIT VOLUNTEE DONATION EQUITY2 % African American Students TE. RATIO STA. RATI SQ.FT % Teachers with MA +9 TURNOVER # Students COMPUTER EXPENDIT VOLUNTEE DONATION EQUITY2 % African American Students TE. RATIO STA.RATI SQ.FT % Teachers with MA +9 TURNOVER # Students 1.000 -.541 -.548 -.249 -.735 .270 -.439 .538 -.560 .755 -.582 -.664 .346 .339 .686 .157 .661 .460 .350 .326 .140 .303 .222 5 5 5 5 5 5 5 5 5 5 5 5 -.541 -.548 -.249 -.735 .270 -.439 1.000 .996** -.564 .996** 1.000 -.593 -.564 -.593 1.000 .402 .347 .487 -.221 -.177 .004 .924* .942* -.599 .402 .347 .487 1.000 -.463 .190 -.221 .924* -.380 .045 .030 .054 -.159 -.177 .942* -.330 .058 -.014 .078 -.179 .004 -.599 -.449 .168 -.494 .508 .749 -.463 .190 -.845 .295 -.311 .362 .682 1.000 .164 -.035 -.716 -.135 .561 -.508 .164 1.000 -.350 -.208 -.032 .256 -.368 .346 .000 .322 .502 .721 .025 .528 .942 .962 .931 .799 5 5 5 5 5 5 5 5 5 5 5 5 .339 .686 .157 .661 .460 .000 .292 .567 .776 .017 .588 .927 .983 .901 .774 5 5 5 5 5 5 5 5 5 5 5 5 .322 .292 .502 .567 .405 .721 .776 .995 .025 .017 .286 .405 .995 .286 .448 .787 .397 .382 .145 5 5 5 5 5 5 5 5 5 5 5 5 .432 .759 .432 .759 .071 .629 .611 .550 .205 5 5 5 5 5 5 5 5 5 5 5 5 .793 .793 .956 .174 .829 1326 .383 5 5 5 5 5 5 5 5 5 5 5 5 .563 .737 .959 .677 .542 5 5 5 5 5 5 5 5 5 5 5 5 Page 2High School Correlations COMPUTER EXPENDIT VOLUNTEE DONATION EQUITY? Pearson Correlation Sig. (2-tailed) N % African American Students TE.RATIO STA.RATI SQ.FT % Teachers with MA +9 TURNOVER # Students COMPUTER EXPENDIT VOLUNTEE DONATION EQUITY? % African American Students TE.RATIO STA. RATI SQ.FT % Teachers with MA +9 TURNOVER # Students COMPUTER EXPENDIT VOLUNTEE DONATION EQUITY? % African American Students TE.RATIO STA.RATI SQ.FT % Teachers with MA +9 TURNOVER # Students COMPUTER EXPENDIT VOLUNTEE DONATION EQUITY? .538 -.560 .755 -.582 -.664 -.380 -.330 -.449 -.845 -.035 -.350 1.000 .226 .205 -.598 -.328 .350 .528 .588 .448 .071 .956 .563 .714 .741 .287 .590 5 5 5 5 5 5 5 5 5 5 5 5 .045 .058 .168 .295 -.716 -.208 .226 1.000 -.511 -.122 .743 .326 .942 .927 .787 .629 .174 .737 .714 .379 .845 .151 5 5 5 5 5 5 5 5 5 5 5 5 **. Correlation is significant at the 0.01 level (2-tailed). .030 -.014 -.494 -.311 -.135 -.032 .205 -.511 1.000 -.766 -.665 .140 .962 .983 .397 .611 .829 .959 .741 .379 .131 .221 5 5 5 5 5 5 5 5 5 5 5 5 .054 .078 .508 .362 .561 .256 -.598 -.122 -.766 1.000 .320 .303 .931 .901 .382 .550 .326 .677 .287 .845 .131 .599 5 5 5 5 5 5 5 5 5 5 5 5 -.159 -.179 .749 .682 -.508 -.368 -.328 .743 -.665 .320 1.000 .222 .799 .774 .145 .205 .383 .542 .590 .151 .221 .599 5 5 5 5 5 5 5 5 5 5 5 5 Page 3Junior High School Correlations Pearson Correlation Sig. (2-tailed) N % African American Students TE.RATIO ST A. RATI SQ.FT % Teachers with MA +9 TURNOVER # Students COMPUTER EXPENDIT VOLUNTEE DONATION EQUITY2 % African American Students TE.RATIO STA.RATI SQ.FT % Teachers with MA +9 TURNOVER # Students COMPUTER EXPENDIT VOLUNTEE DONATION EQUITY2 % African American Students TE.RATIO STA.RATI SQ.FT % Teachers with MA +9 TURNOVER # Students COMPUTER EXPENDIT VOLUNTEE DONATION EQUITY2 % African American Students 1.000 -.550 -.615 .531 -.641 -.726* -.704 .418 -.488 -.722* -.372 -.479 .158 .104 .176 .087 .042 .051 .303 .220 .043 .365 .230 8 8 8 8 8 8 8 8 8 8 8 8 TE.RATIO STA.RATI SQ.FT % Teachers with MA +9 TURNOVER # Students -.550 -.615 .531 -.641 -.726* -.704 1.000 .978** -.113 .978** 1.000 -.182 -.113 -.182 1.000 .403 .439 .108 .117 .170 -.148 .816* .868*' -.330 .403 .439 .108 1.000 .527 .548 .117 .816* -.144 .423 .481 -.030 .325 .170 .868** -.210 .438 .536 .134 .318 -.148 -.330 .250 .153 -.074 -.631 .093 .527 .548 -.170 .579 .634 -.151 .524 1.000 .155 -.431 .174 .390 .309 .266 .155 1.000 .059 .654 .700 .271 .621 .158 .000 .790 .323 .782 .013 .734 .296 .228 .944 .432 8 8 8 8 8 8 8 8 8 8 8 8 .104 .000 .667 .277 .687 .005 .617 .278 .171 .752 .443 8 8 8 8 8 8 8 8 8 8 8 8 .176 .790 .667 .798 .726 .424 .550 .717 .861 .093 .828 8 8 8 8 8 8 8 8 8 8 8 8 .087 .323 .277 .798 .180 .159 .687 .133 .091 .722 .182 8 8 8 8 8 8 8 8 8 8 8 8 .042 .782 .687 .726 .180 .714 .287 .680 .340 7457 .524 8 8 8 8 8 8 8 8 8 8 8 8 .051 .013 .005 .424 .159 .714 .890 .078 .053 .516 .100 8 8 8 8 8 8 8 8 8 8 8 8 Page 2Junior High School Correlations COMPUTER EXPENDIT VOLUNTEE DONATION EQUITY2 Pearson Correlation Sig. (2-tailed) N % African American Students TE.RATIO STA.RATI SQ.FT % Teachers with MA +9 TURNOVER # Students COMPUTER EXPENDIT VOLUNTEE DONATION EQUITY2 % African American Students TE.RATIO STA.RATI SQ.FT % Teachers with MA +9 TURNOVER # Students COMPUTER EXPENDIT VOLUNTEE DONATION EQUITY2 % African American Students TE.RATIO STA.RATI SQ.FT % Teachers with MA +9 TURNOVER # Students COMPUTER EXPENDIT VOLUNTEE DONATION EQUITY2 .418 -.144 -.210 .250 -.170 -.431 .059 1.000 .123 -.198 -.097 .400 .303 .734 .617 .550 .687 .287 .890 .772 .638 .819 .327 8 8 8 8 8 8 8 8 8 8 8 8 -.488 .423 .438 .153 .579 .174 .654 .123 1.000 .932** -.133 .909** .220 .296 .278 .717 .133 .680 .078 .772 .001 .753 .002 8 8 8 8 8 8 8 8 8 8 8 8 * Correlation is significant at the 0.05 level (2-tailed). -.722* -.372 -.479 .481 .536 -.074 -.030 .134 -.631 .325 .318 .093 .634 -.151 .524 .390 .700 -.198 .932* 1.000 .056 .792* .309 .271 -.097 -.133 .056 1.000 -.030 .266 .621 .400 .909* .792* -.030 1.000 .043 .365 .230 .228 .171 .861 .091 .340 .053 .638 .001 .895 .019 8 8 8 8 8 8 8 8 8 8 8 8 I .944 .752 .093 .722 .457 .516 .819 .753 .895 .943 8 8 8 8 8 8 8 8 8 8 8 8 .432 .443 .828 .182 .524 .100 .327 .002 .019 .943 8 8 8 8 8 8 8 8 8 8 8 8 Page 3- Elementary School Correlations Pearson Correlation Sig. (2-tailed) N % African American Students TE.RATIO STA.RATI SQ.FT % Teachers with MA +9 TURNOVER # Students COMPUTER EXPENDIT VOLUNTEE DONATION EQUITY2 % African American Students TE.RATIO STA.RATI SQ.FT % Teachers with MA +9 TURNOVER # Students COMPUTER EXPENDIT VOLUNTEE DONATION EQUITY2 % African American Students TE.RATIO STA.RATI SQ.FT % Teachers with MA +9 TURNOVER # Students COMPUTER EXPENDIT VOLUNTEE DONATION EQUITY2 % African American Students TE.RATIO STA.RATI SQ.FT % Teachers with MA +9 TURNOVER # Students 1.000 -.294 -.369* .114 -.120 .380* -.499* -.294 -.369* .114 -.120 .380* -.499** .015 .019 -.399* .358* -.050 .086 .029 .514 .494 .025 .002 .932 .915 .017 .034 .775 35 35 35 35 35 35 35 35 35 35 35 35 1.000 .927** -.642** .452** -.326 .335* -.289 -.714** -.187 -.238 -.688** .086 .000 .000 .006 .056 .049 .092 .000 .282 .168 .000 35 35 35 35 35 35 35 35 35 35 35 35 .927' 1.000 -.683 1** .448** -.426* .379* -.281 -.678** -.131 -.223 -.649** .029 .000 .000 .007 .011 .025 .102 .000 .452 .199 .000 35 35 35 35 35 35 35 35 35 35 35 35 -.642** -.683** 1.000 .452** .448** -.402* -.326 -.426* .278 .335* .379* -.315 -.402* 1.000 -.178 -.063 .278 -.315 .098 .395* .077 .181 .525** -.178 -.063 -.169 -.415* -.085 -.241 -.165 1.000 -.342* -.221 .183 -.089 .265 -.071 -.342* 1.000 .079 -.073 .034 -.283 -.005 .514 .494 .025 .002 .000 .000 .017 .106 .065 .577 .019 .658 .299 .001 35 35 35 35 35 35 35 35 35 35 35 35 .006 .007 .017 .307 .721 .331 .013 .628 .163 .342 35 35 35 35 35 35 35 35 35 35 35 35 .056 .011 .106 .049 .025 .065 .307 .044 .202 .294 .610 .124 .683 35 35 35 35 35 35 35 35 35 35 35 35 .721 .044 .652 .677 .847 .100 .976 35 35 35 35 35 35 35 35 35 35 35 35 Page 2Elementary School Correlations COMPUTER EXPENDIT VOLUNTEE DONATION EQUITY2 Pearson Correlation Sig. (2-tailed) N % African American Students TE.RATIO STA.RATI SQ.FT % Teachers with MA +9 TURNOVER # Students COMPUTER EXPENDIT VOLUNTEE DONATION EQUITY2 % African American Students TE.RATIO STARATI SQ.FT % Teachers with MA +9 TURNOVER # Students COMPUTER EXPENDIT VOLUNTEE DONATION EQUITY2 % African American Students TE.RATIO STARATI SQ.FT % Teachers with MA +9 TURNOVER # Students COMPUTER EXPENDIT VOLUNTEE DONATION EQUITY2 .015 .019 -.399* .358* -.050 -.289 -.281 .098 -.169 -.221 .079 1.000 .537** .301 -.009 .629** .932 .092 .102 .577 .331 .202 .652 .001 .079 .959 .000 35 35 35 35 35 35 35 35 35 35 35 35 -.714** -.678** .395* -.415* .183 -.073 .537** 1.000 .482** .195 .706** .915 .000 .000 .019 .013 .294 .677 .001 .003 .261 .000 35 35 35 35 35 35 35 35 35 35 35 35 *. Correlation is significant at the 0.05 level (2-tailed). -.187 -.131 .077 -.085 -.089 .034 .301 .482** 1.000 -.036 .494** .017 .282 .452 .658 .628 .610 .847 .079 .003 .836 .003 35 35 35 35 35 35 35 35 35 35 35 35 -.238 -.223 .181 -.241 .265 -.283 -.009 .195 -.036 1.000 .212 .034 .168 .199 .299 .163 .124 .100 .959 .261 .836 .221 35 35 35 35 35 35 35 35 35 35 35 35 -.688* -.649* .525*' -.165 -.071 -.005 .629* .706*' .494* .212 1.000 .775 .000 .000 .001 .342 .683 .976 .000 .000 .003 .221 35 35 35 35 35 35 35 35 35 35 35 35 Page 3File Information List of variables on the working file Name Position SCHOOL School Print Format: F8.2 Write Format: F8.2 1 Value Label 1.00 2.00 3.00 4.00 5.00 6.00 7.00 8.00 9.00 10.00 11.00 12.00 13.00 14.00 15.00 16.00 17.00 18.00 19.00 20.00 21.00 22.00 23.00 24.00 25.00 26.00 27.00 28.00 29.00 30.00 31.00 32.00 33.00 34.00 35.00 36.00 37.00 38.00 39.00 40.00 41.00 42.00 43.00 44.00 45.00 46.00 47.00 48.00 Central J.A. Fair Hall McClellan Parkview Cloverdale Junior High Dunbar Forest Heights Henderson Mabelvale Junior High Mann Magnet Pulaski Heights Southwest Badgett Bale Baseline Booker Magnet Brady Carver Magnet Chicot Cloverdale Elementary Dodd Fair Park Forest Park Franklin Fulbright Garland Geyer Springs Gibbs magnet Jefferson King Mabelvale Elementary McDermott Meadowcliff Mitchell Otter Creek Pulaski heights Rightsell Rockefeller Romine Terry Wakefield Washington Watson Western Hills Williams Magnet Wilson Woodruff TE.RATIO / 2 Print Format
F8.2 Write Format: F8.2 Page 1school 1 1.00 2 2.00 3 3.00 4 4.00 5 5.00 C:\Program Files\SPSS\Milhollen.sav te. ratio sta.rati sq.ft teach 18.52 14.23 12.60 14.19 15.34 12.54 143.84 52.00 9.18 8.32 9.53 10.21 174.75 192.84 138.05 182.74 52.00 48.00 41.00 55.00 6 6.00 13.88 9.73 131.67 29.00 7 7.00 15.80 10.98 128.92 44.00 8 8.00 12.63 8.77 108.47 42.00 9 9.00 13.58 9.41 142.56 35.00 10 10.00 12.08 8.25 122.60 29.00 11 11.00 14.72 10.48 131.72 48.00 12 12.00 13.62 9.99 95.46 37.00 13 13.00 12.03 8.50 162.68 42.00 14 14.00 13.20 7.14 100.45 46.00 1-1turnover 1 15.00 2 12.00 3 18.00 4 14.00 CAProgram Files\SPSS\Milhollen.sav student# computer ex pendit donation 1855.00 757.00 790.00 935.00 .04 .07 .09 .30 59.34 57.73 55.58 120.94 4.84 1.19 6.76 .43 5 10.00 911.00 .11 262.20 3.79 6 4.00 622.00 .04 39.58 .00 7 16.00 771.00 .04 74.56 .00 8 10.00 648.00 .08 54.05 .00 9 7.00 724.00 .24 114.14 1.52 10 14.00 506.00 .07 54.98 1.81 11 14.00 858.00 .05 278.19 .87 12 15.00 767.00 .04 52.40 10.26 13 14.00 510.00 .05 54.47 .12 14 19.00 233,00 i 1-2 .01 68.07 .001 2 3 4 5 6 7 8 9 10 11 12 13 14 equity2 37.00 39.00 40.00 36.00 45.00 30.00 35.00 34.00 39.00 35.00 43.00 34.00 33.00 31.00 C:\Program Files\SPSS\Milhollen.sav black 59.00 81.00 71.00 84.00 51.00 89.00 57.00 70.00 86.00 75.00 52.00 57.00 84.00 92.00 i free 19.00 26.00 27.00 29.00 10.00 58.00 35.00 45.00 42.00 26.00 25.00 26.00 63.00 79.00 1-3school 15 15.00 16 16.00 17 17.00 18 18.00 19 19.00 20 20.00 21 21.00 CAProgram Files\SPSS\Milhollen.sav te.ratio sta.rati sq.ft teach 14.03 15.40 13.42 17.44 15.20 17.07 19.59 7.75 7.80 9.37 9.78 9.33 8.48 11.59 \ 92.89 156.21 124.84 97.47 103.52 111.15 64.97 55.00 53.00 48.00 67.00 42.00 44.00 49.00 22 22.00 12.95 7.47 208.54 47.00 23 23.00 15.25 7.85 116.40 63.00 24 24.00 18.70 11.32 74.22 44.00 25 25.00 10.74 5.30 147.63 26.00 26 26.00 17.19 9.54 135.14 48.00 27 27.00 11.61 5.35 142.55 17.00 28 28.00 16.73 8.26 132.22 53.00 2-1turnover 15 21.00 16 39.00 17 10.00 18 8.00 CAProgram Files\SPSS\Milhollen.sav student# computer expendit donation 362.00 323.00 597.00 372.00 .10 .01 .07 .11 74.93 77.89 212.17 69.33 9.32 4.80 .00 8.69 19 11.00 596.00 .06 243.28 .00 20 8.00 537.00 .28 107.68 3.98 21 9.00 512.00 .08 69.35 .00 22 .00 224.00 .06 66.18 .00 23 20.00 248.00 .00 82.12 1.01 24 5.00 430.00 .05 59.90 24.98 25 5.00 464.00 .16 252.18 16.38 26 6.00 495.00 .03 62.30 .11 27 20.00 271.00 .04 245.87 .37 28 17.00 316.00 .08 84.64 1 5.34 2-215 16 17 18 19 20 21 22 23 24 25 26 27 28 equityZ 41.00 37.00 42.00 40.00 42.00 44.00 29.00 43.00 35.00 37.00 48.00 39.00 37.00 41.00 i C:\Program Files\SPSS\Milhollen.sav black 73.00 83.00 52.00 63.00 52.00 69.00 92.00 65.00 76.00 76.00 92.00 48.00 93.00 75.00 free 65.00 84.00 36.00 45.00 31.00 71.00 77.00 67.00 65.00 34.00 79.00 32.00 90.00 66.00 2-3 /29 30 31 32 33 34 35 36 37 38 39 40 41 42 school 29.00 30.00 31.00 32.00 33.00 34.00 35.00 36.00 37.00 38.00 39.00 40.00 41.00 42.00 C:\Program Files\SPSS\Milhollen.sav te.ratio sta.rati sq.ft teach 12.29 18.93 17.68 16.36 17.73 17.95 10.23 19.76 20.26 11.00 10.70 12.70 18.12 18.20 7.72 11.66 8.36 9.63 11.02 10.18 5.07 10.90 11.84 5.85 4.41 7.47 10.83 10.26 119.73 84.88 113.98 136.53 100.67 111.24 161.98 111.44 125.54 151.12 159.41 129.01 88.67 100.25 40.00 68.00 40.00 23.00 31.00 54.00 25.00 59.00 47.00 39.00 29.00 40.00 29.00 71.00 3-1turnover 29 4.00 30 9.00 31 9.00 32 7.00 33 15.00 34 12.00 35 31.00 36 4.00 37 11.00 38 13.00 39 18.00 40 14.00 41 6.00 42 11.00 CAProgram Files\SPSS\Milhollen.sav student# computer expendit donation 311.00 513.00 658.00 407.00 477.00 332.00 242.00 328.00 464.00 249.00 405.00 328.00 511.00 373.00 3-2 .26 .05 .00 .10 .03 .01 .07 .02 .08 .12 .25 .04 .02 .01 294.14 62.29 64.58 71.21 60.43 61.34 283.47 65.98 58.69 257.44 533.19 200.61 57.21 58.73 1.61 .63 .23 5.88 27.20 13.25 53.72 10.37 7.28 33.77 3.33 9.56 .00 8.8129 30 31 32 33 34 35 36 37 38 39 40 41 42 equity 2 49.00 36.00 38.00 36.00 33.00 33.00 42.00 36.00 32.00 50.00 50.00 44.00 31.00 34.00 C:\Program Files\SPSS\Milhollen.sav black 52.00 44.00 54.00 73.00 57.00 79.00 92.00 46.00 55.00 94.00 59.00 63.00 46.00 86.00 I I i free 33.00 37.00 43.00 71.00 41.00 73.00 92.00 35.00 43.00 76.00 59.00 45.00 28.00 75.00 3-3 I43 44 45 46 47 48 school 43.00 44.00 45.00 46.00 47.00 48.00 C:\Program Files\SPSS\Milhollen.sav te. ratio sta.rati sq.ft teach 13.03 17.64 18.42 15.40 14.89 14.04 4-1 7.58 10.45 10.75 9.16 8.98 7.72 136.06 109.22 64.64 98.54 102.42 133.80 34.00 39.00 52.00 63.00 76.00 30.00turnover 43 7.00 CAProgram Files\SPSS\Milhollen.sav student# computer expendit donation 660.00 .06 92.63 1.12 44 13.00 493.00 .15 77.43 2.55 45 .00 315.00 .10 67.20 .00 46 11.00 479.00 .09 237.38 .00 47 4.00 362.00 .09 60.03 3.57 48 27.00 284.00 .02 85.65 .00 4-243 44 45 46 47 48 CAProgram Files\SPSS\Milhollen.sav equity2 42.00 37.00 31.00 41.00 41.00 32.00 black 53.00 89.00 70.00 52.00 82.00 71.00 free 54.00 75.00 54.00 19.00 71.00 60.00 4-3f Descriptives sqTT Mean 95% Confidence Interval for Mean Statistic 125.0756 Std. Error 4.4905 5% Trimmed Mean Median Variance Std. Deviation Minimum Maximum Range Interquartile Range % Students free lunch Skewness Kurtosis________ Mean 95% Confidence Interval for Mean 5% Trimmed Mean Median Variance Std. Deviation Minimum Maximum Range Interquartile Range Skewness Kurtosis__ Weighted SOTT Average(Definition % 1) Tukey's Hinges Students free lunch SQ.FT Lower Bound Lipper Bound 1 16.0419 134.1094 124.3022 125.1900 967.909 31.1112 64.64 208.54 143.90 41.4500 .419 .315 50.7500 .343 .674 3.1096 Lower Bound Upper Bound 44.4942 57.0058 50.5509 45.0000 464.149 21.5441 10.00 92.00 82.00 38.7500 .127 -1.161 .343 .674 Percentiles 5 69.1325 19.0000 10 88.2910 25.9000 25 101.1075 32.2500 101.5450 Percentiles 50 125.1900 75 142.5575 90 163.8870 95 188.2950 45.0000 71.0000 79.0000 87.3000 125.1900 142.5550 Page 2Extreme Values Highest 1 2 3 4 5 Case Number 22 3 5 2 13 Lowest 1 2 3 45 21 24 % Students free lunch Highest Lowest 4 5 1 2 3 4 5 1 2 3 4 5 ( 30 41 35 27 16 14 25 5 46 1 11 10 School Dodd Hall Parkview J.A. Fair Southwe st Western Hills Cloverd ale Element ary Forest Park Jefferson Terry Mitchell Garland Baseline Badgett Franklin Parkview Williams Magnet Central Mann Magnet Mabelva Ie Junior High Value 208.54 192.84 182.74 174.75 162.68 64.64 64.97 74.22 84.88 88.67 92.00 90.00 84.00 79.00 79.00 10.00 19.00 19.00 25.00 a. Only a partial list of cases with the value 26 are shown in the table of lower extremes. Page 3Equitable Allocation Worksheet School Score 1. Pupil/Teacher Ratio 7 6 5 4 3 2 1 (10.71) (11.54) (12.97) (15.5) (17.67) (18.72) (19.68) 2. Pupil/StafT Ratio 7 6 5 4 3 2 1 (5.17) (5.80) (7.76) (9.25) 3. (10.40) (11.34) (11.76) Percent of Students Receiving Free Lunch 2 1 3 4 5 6 7 (19.00) (25.90) (32.25) (45.00) (71.00) (79.00) (87.30) 4. Square Feet per Pupil 7 5 6 3 4 2 1 (69.13) (88.29) (101.11) (125.19) (142.56) (163.89) (188.29) 5. Percent of Staff with a Masters Degree, plus, Nine Years of Experience 1 2 3 4 5 6 7 (23.9) (28.7) (35.5) (44.0) (52.75) (63.4) (69.65) 6. Turnover Rate of Certified Staff 2 1 4 3 5 6 1 (1.80) (4.00) (7.00) (11.00) (15.00) (20.10) (29.20) 7. School Size / ! High School 7 6 5 4 3 2 1 (773) (911) (1395) 8. Middle School 2 (506) Elementary (231) (246) (538) (686) 5 (770) (315) (373) (495) 6 (596) 7 (658) Computer/Pupil Ratio 1 1 2 3 3 4 4 5 6 7 1 2 3 4 5 6 7 (.0062) (.0118) (.0351) (.0625) (.0981) (.2410) (.2695) 9. Per Pupil Expenditure 1 2 3 4 5 6 7 (53.14) (54.93) (59.93) (70.28) (180.69) (263.80) (289.34)10. Volunteer Hours per Pupil 7 6 5 4 3 2 1 (.3125) (.579) (1.90) (5.195) (12.10) (19.58) (27.73) 11. Donations per Pupil 1 (.00) 7 6 5 4 3 2 (.00) (.0275) (1.71) (8.34) (17.24) (30.81)High School Middle School Elementary School 42- McClellan 43 44- Central 45- J. A. Fair 46- Hall 47 48 49 50 51 52- Parkview 34- Cloverdale 35 36 37- Southwest 38- Forest Heights 39 40- Dunbar, Pulaski Heights 41- Mabelvale 42 43 44- Henderson 45 46 47 48 49 50- Mann 32- Cloverdale 33 34- Badgett 35-Western Hills 36- Meadowcliff, Woodruff 37- Pulaski Heights, Terry, Wakefield 38- McDermott 39- Baseline, Fair Park, Garland, Mabelvale 40- Watson 41- Jefferson, Otter Creek 42- Forest Park 43- King, Mitchell 44- Brady, Wilson 45- Bale, Fulbright, Geyer Springs 46- Washington 47- Booker, Chicot, Dodd 48- Carver, Romine, Williams 49 50 51-Franklin 52 53- Rightsell 54- Gibbs, Rockefeller1. Pupil/Tcacher Ratio Equitable Allocation Worksheet 7 6 5 4 3 2 1 (10.71) (11.54) (12.97) (15.5) (17.67) (18.72) (19.68) 2. Pupil/StafT Ratio 1 6 5 4 3 2 1 (5.17) (5.80) (7.76) (9.25) (10.40) (11.34) (11.76) 3. Square Feet per Pupil 6 7 5 3 4 2 1 (69.13) (88.29) (101.11) (125.19) (142.56) (163.89) (188.29) 4. Percent of Staff with a Masten Degree, plus, Nine Yean of Experience 1 1 3 4 5 6 7 (23.9) (28.7) (35.5) (44.0) (52.75) (63.4) (69.65) 5. Turnover Rate of Certified Staff 1 3 2 4 5 7 6 (1.80) (4.00) (7.00) (11.00) (15.00) (20.10) (29.20) 6. School Size High School 7 5 6 4 3 1 2 {713) (911) (1395) 7. Middle School 2 (506) Elementary (231) (246) (538) (686) (770) (315) (373) (495) 6 (596) 7 (658) Computer/Pupil Ratio 1 1 2 3 3 4 4 5 5 6 7 1 2 3 4 5 6 7 (.0062) (.0118) (.0351) (.0625) (.0981) (.2410) (.2695) 8. Per Pupil Expenditure 1 2 3 4 5 6 7 (53.14) (54.93) (59.93) (70.28) (180.69) (263.80) (289.34) 9, Volunteer Houn per Pupil 1 2 3 4 5 6 7 (.3125) (.579) (1.90) (5.195) (12.10) (19.58) (27.73) 10. Donations per Pupil 1 (.00) 7 6 5 4 3 2 (.00) (.0275) (1.71) (8.34) (17.24) (30.81)High School Middle School Elementary School 36- McClellan 37- Central 38 39- J. A. Fair 40- Hall 41 42 43 44 45- Parkview 30- Cloverdale 31 32 33- Southwest 29- Cloverdale 30 31- Badgett, Terry, Western Hills 32- Pulaski Heights, Woodruff 34- Forest Heights, Pulaski Heights 33- McDermott, MeadowclifT 35- Dunbar, Mabelvale 36 37 38 39- Henderson 40 41 42 43- Mann 34- Wakefield 35-Fair Park 36- Jefferson, Mabelvale, Otter Creek 37- Baseline, Forest park. Garland, Watson 38- King 39- Fulbright 40- Brady 41- Bale, Geyer Springs, Williams, Wilson 42- Booker, Carver, Mitchell, Washington 43-Dodd 44- Chicot, Romine 45 46 47 48- Franklin 49- Gibbs 50- Rightsell, Rockefeller 36-1 37-1 38 39-1 40-1 41 42 43 44 45-1 30-1 31 32 33-1 34-n 35-n 36 37 38 39-1 40 41 42 43-n 29-1 30 31-ni 32-n 33-n 34-1 35-1 36- HI 37- nil 38-1 39-1 40-1 41-nil 42- nil 43-1 44-n 45 46 47 48-1 49-1 50-1110/05/1998 14:59 5013240504 LRSD PAGE 02 Memo To
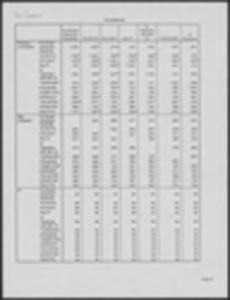
From
Equitable Allocation Workgroup Dr. Ed Williams, P. R, & E. RE. Total score correlation While I will provide you with the correlation matrices at the meeting tomorrow, I felt you would benefit from some data peeking. I correlated the percent of African American students in each school to total score and to each of the ten variables (c.g., turnover, donation, teacher/student ratio, etc.). For all levels combined and individually (i.e., high school, junior high, and elemeittary schools) there was no significant correlation between scores on the Equitable Allocation Worksheet and the percent of African American students. In addition to the correlation matrices, I will provide you with school scores on the EAW, and the data sheets.received MAY 2 6 1998 Little Rock School District OFFICE OF DESEGREGATION MONITORING May 22, 1998 Ann Brown Desegregation Monitor Office of Desegregation Monitoring 201 East Markham, Suite 510 Little Rock, AR 72201 Dear TVnn: One of the elements of the "Revised Desegregation and Education Plan" is that within 60 days of its approval. the LRSD will develop process or standard for assessing the equitable allocation of resources. This letter is to ask you or members of your staff to attend a meeting at 1:30 p.m., Wednesday, June 3, 1998, in the LRSD Board room for the purpose of discussing that process. Skip and Gene were very helpful when we discussed this issue in the development of the revised plan. Mr. Walker has been invited to attend, also. Thank you for your assistance. Sincerely, Brady Gadberry Director of Labor Relations Leslie Gamine Clay Pendley 810 West Markham Street Little Rock, Arkansas 72201 (501)324-2000 cc: aOffice of Desegregation Monitoring United States District Court Eastern District of Arkansas Ann S. Brown, Federal Monitor 201 East Markham. Suite 510 Heritage West Building Little Rock, Arkansas 72201 (501)376-6200 Fax (501) 371-0100 Date: May 27, 1998 To: Brady Gadberry From: Ann Bro Re: Invitation to Discuss LRSD Equitable Allocation of Resources Thanks for your invitation to participate in a discussion of the process the LRSD will use for assessing the equitable allocation of its resources. Ill plan on being there, along with my one or two of my associates, on June 3, 1998 at 1:30 p.m. I look forward to seeing you then. - - -^06/05/98 15:11 Q FRIDAY LAW FIRM @002 FRIDAY. ELDREDGE & CLARK HERSCHEL M. FRIDAY {ISJS-liSA) WILLIAM M. SUTTON. P.A. JAMES W, MOORE BYRON M. EI8CMAN. JR.. P-A. JOE 0. BELL. P.A. JOHN C. ECHOLS. P.A. JAMES A. BUTTRY, P.A. FREDERICK S. UR8CRY. P.A. OSCAR E. DAVIS, JR.. P.A. JAMES C. CLARK. JR., P-A. THOMAS P. LEGGETT, P.A. JOHN DEWEY WATSON. P.A. PAUL 8. BENHAM III. P.A. LARRY W. SORAS. F.A. A. WYCKLIFP M18ET, JR.. P.*- JAMES EDWARD HARRIS. R.A. A PARTNERSHIP OF INDIVIDUALS AND professional associations attorneys at law 2000 FIRST COMMERCIAL BUILDING 400 WEST CAPITOL AVENUE little rock. ARKANSAS 7220,-343 TELEPHONE 601-37-2011 FAX NO. 601-376-2147 scon J LAHCASTtft. I M GAYLt CORLEY. P.A ROBERT 8. BEACH. JR . P A J. PHILLIP MALCOM. P.A. JAMES M. SIMPSON. P.A. JAMES M. SAXTON. P.A, J, SHEPHERD RUSSELL III. P A. DONALD H. BACON. P.A. WILLIAM THOMAS BAXTER. P-A. WALTER A. PAULSON It. P.A. BARRY E COPLIN. P.A. RICHARD 0. TAYLOR. P.A. JOSEPH a. HURST. JR., P-A. ELIZABETH ROBBEN MURRAY. P.A. CHRISTOPHER HELLER. P A. LAURA HENSLEY SMITH, P.A. ROBERT S. SHAFER. P.A. WILLIAM M. GRIFFIN III. P.A. MICHAEL 8. MOORE. P.A. DIANE S. MACKEY. P.A. WALTER M. EBEL UI. P.A. KEVIN A. CRASS. P.A. WILLIAM A. WADDELL, JR.. P-A. VIA TELECOPY NO. 374-4187 Mr. John W. Walker June 5, 1998 J LEE BROWN. P.A JAMES C. BAKER. JR P * marry a light. P SCOTT M. TUCKER. P.* JOHN CLAYTON RANDOLPH i A QUY ALTON WADE. P A PRICE C. GARDNER, P A. TONIA P. JONES. P.A, DAVID D. WILSON, P A JEFFREY H. MOORE. P.A. ANDREW T. TURNER. P A. OAVlO M. GRAf. P.A. CARLA GUNNELS SPAINhOUR. P.A JOHN C. FENOLEY. JR . P.A ALLISON GRAVES WARNER. P a JONANN C. ROOSEVELT K. CHRISTOPHER LAWSON GREGORY 0. TAYLOR TONY I WILCOX FRAN C. HICKMAN BETTY J. DEMORY BARBARA J. RANO JAMES W . SMITH CLIFFORD W. PLUNKETT DANIEL L. HERRINGTON ALLISON J. CORNWELL TOOO A. GREER ELLEN M. OWENS HELENE N. RAYDER JASON B. HENDREN SUSAN N. CHILDERS 0* COWM(l WILLIAM J. SMITH BS CLARK WILLIAM L. TERRY WILLIAM L. PATTON. JR H.T. LARZELER6. P A. VIA TELECOPY NO. 371-01011 Ms. Ann Brown n.Tia-t OIRiC T MO. 16011 370-3323 VIA TELECOPY NO. 324-2146 Mr. Brady Gadberry RE: Equitable Allocation of Resources Dear Ms. Brown and Gentlemen: draft Notice of Process for Assessing Attached please find a the Equitable Allocation for is^an^roJ District court's approval ot Paragraph 2 of the Notice we would propose be a the final report within 180 days of the Revised Plan as provided in Ecc_2 Section 2.92. We would appreciate your file the Notice on June 9, you. comments and suggestions before we 1998. we look forward to hearing from We Sincerely, 3hn CV Pendley, Jr. John Pendley JCFjr/jcg Enclosure-06/05/98 15:12 FRIDAY LAW FIRM 003 u IN THE UNITED STATES DISTRICT COURT EASTERN DISTRICT OF ARKANSAS WESTERN DIVISION LITTLE ROCK SCHOOL DISTRICT PLAINTIFF V. LR-C-82-866 PULASKI COUNTY SPECIAL SCHOOL DISTRICT NO. 1, ET AL DEFENDANTS MRS. LORENE JOSHUA, ET AL INTERVENORS KATHERINE KNIGHT, ET AL INTERVENORS 1H NOTICE OF PROCESS FOR ASSESgING__ EQUITABLE ALLOCATION OF RESOURCES The Little Rock School District ("LRSD") for its Notice of Process for Assessing the Equitable Allocation of Resources states: 1. Section 2.9.1 of LRSD's Revised Desegregation and Education Plan dated January 16, 1997 ("Revised Plan") provides: Within sixty (60) days of the district court's approval of this Revised Plan, LRSD, after consultation with, will develop a process or standard for assessing the equitable allocation of resources. 2. In compliance with Section 2.9.1, LRSD, after consultation with Joshua, has developed a process for assessing the equitable allocation of resources. UiSD, working with Joshua and the Office of Desegregation Monitoring ("ODM"), shall. (a) Identify the resources to be considered in assessing the equitable allocation of resources
f:\hom6\fisoiiey196/05/98 15:13 FRIDAY LAW FIRM @004 (b) Develop standard or standards for assessing whether those resources are being distributed on an equitable basis
(c) Assess the current allocation of resources based on the a standard or standards developed
and, (d) Report the results of the assessment. 3. This process will be completed on a timeline consistent with the issuance of a final report within 180 days of this Court's approval of the Revised Plan as provided in Section 2.9.2 of the Revised Plan. Respectfully Submitted, LITTLE ROCK SCHOOL DISTRICT FRIDAY, ELDREDGE & CLARK First Commercial Bldg., Suite 2000 400 West Capitol Little Rock, AR 72201-3493 (501) 376-2011 BY: Christopher Heller (#81083) John C. Fendley, Jr. (#92182 r:MKMMeslby\lnd'dB*-P<d.001 2 .06/05/98 15:13 FRIDAY LAW FIRM Q 005 CERTIFICATE OF SERVICE I certify that a copy of the foregoing following people by depositing a copy of same * T^'***** lyyo mail on this Sth day of June, Mr. John W. Walker JOHN W. WALKER, P.A. 1723 Broadway Little Rock, AR 72201 Mr. Sam Jones Wright, Lindsey & Jennings 2200 Worthen Bank Bldg. 200 West Capitol Little Rock, AR 72201 Mr. Steve Jones JACK, LYON & JONES, P.A. 425 W. Capitol, Suite 3400 Little Rock, AR 72201-3472 Mr. Richard Roachell Mr. Travis Creed Roachell Law Firm First Federal Plaza 401 West Capitol, Suite 504 Little Rock, AR 72201 Ms. Ann Brown - HAND DELIVERED Desegregation Monitor Heritage West Bldg., Suite 510 201 East Markham Street Little Rock, AR 72201 Mr. Timothy G. Gauger Office of the Attorney General 323 Center Street 200 Tower Building Little Rock, AR 72201 ftMuDvXfeatbyUndklM-pU.OOl has been served on the in the United States Christopher Heller John C. Fendley, Jr. 3Office of Desegregation Monitoring United States District Court Eastern District of Arkansas Ann S. Brown, Federal Monitor 201 East Markham, Suite 510 Heritage West Building Little Rock, Arkansas 72201 (501)376-6200 Fax (501) 371-0100 Date
June 8, 1998 BY FAX To: Clay Fendley From: Ann Brow Re
Proposed Process for Assessing Resources Thank you for faxing me your draft of the proposed Process for Assessing the Equitable Allocation of Resources. Here are my observations and suggestions: 1. Correct the omission of the word Joshua in the fourth line of the first paragraph. 2. Item a: In the interest of clarity and accuracy, reword this sentence by eliminating the passive voice and one of the three verbs that cloud the meaning. What we really mean is: Identify the resources the district will assess for equitable allocation. (I trust this will include all resources, including human resources, since equitable personnel allocation is stressed elsewhere in the desegregation plan.) J. Item b: Again for clarity, change whether to read the extent to which those resources are being distributed on an equitable basis. 4. Item c: This sentence designates current resources for equity assessment, yet the language of the new plan implies ongoing assessment of resource allocation. This filing should do the same. 5. Item d: Report the results of the assessment to whom? The superintendent? The board? The parties? The court? The public? Who are the audience(s) who will receive the report? cc: John Walker RECEIV^n IN THE UNITED STATES DISTRICT COURT EASTERN DISTRICT OF ARKANSAS WESTERN DIVISION JUN 9 1998 LITTLE ROCK SCHOOL DISTRICT OFFICE OF desegregation monitoring PLAINTIFF V. LR-C-82-866 PULASKI COUNTY SPECIAL SCHOOL DISTRICT NO. 1, ET AL DEFENDANTS MRS. LORENE JOSHUA, ET AL INTERVENORS KATHERINE KNIGHT, ET AL INTERVENORS NOTICE OF PROCESS FOR ASSESSING THE EQUITABLE ALLOCATION OF RESOURCES The Little Rock School District ("LRSD") for its Notice of Process for Assessing the Equitable Allocation of Resources states
1. Section 2.9.1 of LRSD's Revised Desegregation and Education Plan dated January 16, 1997 ("Revised Plan) provides: Within sixty (60) days of the district court's approval of this Revised Plan, LRSD, after consultation with Joshua, will develop a process or standard for assessing the equitable allocation of resources. 2. In compliance with Section 2.9.1, LRSD, after consultation with Joshua, has developed a process for assessing the equitable allocation of resources. LRSD, working with Joshua and the Office of Desegregation Monitoring ("ODM), shall: (a) Identify the resources the District will assess for equitable allocation
(b) Develop a standard or standards for assessing the extent to which those resources are being distributed on an equitable basis
(c) Assess the allocation of resources based on the standard or standards developed
and, (d) Report the results of the assessment to ODM and Joshua. 3. This process will be completed on a timeline consistent with the issuance of a final report within 180 days of this Court's approval of the Revised Plan as provided in Section 2.9.2 of the Revised Plan. 4. In the above process, LRSD shall consult with the one or both of the desegregation experts retained by LRSD in compliance with Section 2.1.1 of the Revised Plan. Joshua has approved LRSD's retention of Terrance Roberts, one of the original "Little Rock Nine," and Steven Ross, a professor at the University of Memphis, to assist LRSD in development of the programs. policies and procedures required by the Revised Plan. Respectfully Submitted, LITTLE ROCK SCHOOL DISTRICT FRIDAY, ELDREDGE & CLARK First Commercial Bldg., Suite 2000 400 West Capitol Little Rock, AR 72201-3493 (501) 376-2011 BY: Christopher Hell John C. Pendley, r. w92182 f:\home\fendley\lred\des-pld.001 2CERTIFICATE OF SERVICE I certify that a copy of the foregoing has been served on the following people by depositing a copy of same in the United States mail on this 9th day of June, 1998. Mr. John W. Walker JOHN W. WALKER, P.A. 1723 Broadway Little Rock, AR 72201 Mr. Sam Jones Wright, Lindsey & Jennings 2200 Worthen Bank Bldg. 200 West Capitol Little Rock, AR 72201 Mr. Steve Jones JACK, LYON & JONES, P.A. 425 W. Capitol, Suite 3400 Little Rock, AR 72201-3472 Mr. Richard Roachell Mr. Travis Creed Roachell Law Firm First Federal Plaza 401 West Capitol, Suite 504 Little Rock, AR 72201 Ms. Ann Brown HAND DELIVERED Desegregation Monitor Heritage West Bldg., Suite 510 201 East Markham Street Little Rock, AR 72201 Mr. Timothy G. Gauger Office of the Attorney General 323 Center Street 200 Tower Building Little Rock, AR 72201 Christopher Hell^^ John C. Fendley, Jr. f:^facme\feDdley\lnd^de-ptd.001 3CP Little Rock School District JUL 8 jggg July 'll 1998 Ann Brown Desegregation Monitor Office of Desegregation Monitoring 201 East Markham, Suite 510 Little Rock, AR 72201 Dear Ann: Thank you very much for your assistance and OfflCEOf that of your staff when we met about the equitable allocation of resources. This letter is to ask you or members of your staff to continue to meet with us as we prepare to meet the additional requirements associated with the equitable distribution of resources. We are scheduling a weekly meeting for each Thursday morning at 9:30. The meetings will start on August 6, 1998. Mr. Walker is being invited to attend, also. Thank you again for your assistance. Sincerely, Brady Gadberry Director of Labor Relations cc: Leslie Carnine Clay Fendley 810 West Markham Street Little Rock, Arkansas 72201 (501)324-20004 pjl. Little Rock School District September 21,1998 RECS''^D SEP 2 2 1983 John Walker 1723 South Broadway Little Rock, AR 72206 CmCEOF DESEGREGATION MCNJTORIHQ Dear Mr. Walker
This letter is to remind you that you and/or members of your staff are invited to meet with the committee working on the equitable distribution of resources as we prepare to meet those plan requirements. We are continuing to meet each Thursday morning at 9:30 at the administration building. Ann Brown, Skip Marshall, and Gene Jones from ODM have been meeting with us on a regular basis and have been very helpful in helping us explore issues of equity. We have tried to examine models from other school districts that could give us some guidance in this project, and we have examined sample school board policies from the National School Boards Association. We have discovered that we are in relatively uncharted waters. I am enclosing some of the information that we have been using to try to gain some ideas about dealing with this complex issue. We are leaning toward the development of a matrix that shows how each school fares on a series of factors that have an impact on the equitable distribution of resources. However, please let me emphasize that nothing has been finalized. We have discussed a matrix and have begun the developmental process with a few initial drafts. We have not finalized the indicators that will appear on the matrix. Even after the matrix is developed, this is only an initial facet of the process. Before we can adequately decide what should be done to offset any imbalances that could have deleterious impact on students, we must thoroughly assess where we currently stand. The next phase will address the results of the assessment. If we find that we have problems that would necessitate a redistribution of resources or compensation of some sort to offset the inability to acquire resources, the next phase would address those issues. 810 West Markham Street Little RocR, Arkansas 72201 (501)324-2000The efforts of this group have been concentrated on those resources that are not covered by conunitments in other provisions of the plan, commitments are being and/or will be addressed, too. Obviously, those Thank you again for your assistance. Sincerely, Brady Gadberry Special Assistant to the Superintendent cc: Leslie Gamine Ann Brownd Clay FendleyI * *' received OCT 7 IN THE UNITED STATES DISTRICT COURT OTlKOF.- EASTERN DISTRICT OF ARKANSAS WESTERN DIVISION I ' 7 P)' i
- I LITTLE ROCK SCHOOL DISTRICT U.^ BY. Cl c CH I- A, L - PLAINTIFF V. LR-C-82-866 PULASKI COUNTY SPECIAL SCHOOL DISTRICT NO. 1,ET AL DEFENDANTS MRS. LORENE JOSHUA, ET AL INTERVENORS KATHERINE KNIGHT, ET AL INTERVENORS REPORT OF LRSDS ASSESSMENT OF THE EQUITABLE ALLOCATION OF RESOURCES Plaintiff Little Rock School District (LRSD) for its Report of LRSDs Assessment of the Equitable Allocation of Resources states: 1. LRSDs Revised Desegregation and Education Plan (Revised Plan) requires that LRSD assess the equitable allocation of resources in the district and report the results of this assessment within 180 days of the district courts approval of the Revised Plan. Revised Plan 2.9.2. The district court approved the Revised Plan on April 10, 1998. Docket No. 3144. Accordingly, LRSDs report of the assessment of the allocation of resources was to be completed on or before October 7, 1998. LRSD files this report in compliance with the Revised Plan. 2. LRSD assessed the allocation of its resources by way of a committee composed of district administrators and staff persons and representatives of the Office of DesegregationI Monitoring (ODM).* The committee first worked to determine what resources should be assessed. In this regard, the committee looked to available research in the area of school resources. Based on the available research and the committees collective education and experience, the committee decided to assess the equitable allocation of resources in the district by examination of ten factors: (1) pupil/teacher ratio
(2) pupil/staflf ratio
(3) square feet per pupil
(4) percentage of staff with a masters degree and nine or more years of experience
(5) the turnover rate of certified staff
(6) school size
(7) the computer/pupil ratio
(8) per pupil expenditure
(9) volunteer hours per pupil
and, (10) donations per pupil. 3. Pupil/Teacher Ratio. Research indicates that smaller class sizes (15 or less to 1) may improve achievement of minority students. See, e.g.. Nye, B.A., Achilles, C.M., Zaharias, J.B., Fulton, B.D., Wallenhorst, M.P., Small Is Far Better, Paper presented at Mid-South Educ. Res. Assn, Knoxville, Tenn. (Nov. 13, 1992). The committee measured its pupil/teacher ratio using October 1, 1997 enrollment and certified staff at the school excluding administrators. counselors and librarians. The committee decided to exclude four-year-old classes, which have a smaller pupil/teacher ratio, because not all LRSD schools have four-year-old classes. 4. Pupil/Staff Ratio. The committee also wanted to include a measure which would recognize the importance of school administrators and other support staff at a school. In addition to certified teachers, this factor includes all other school based personnel with the exception of 1' The committee members were as follows: Dr. Victor Anderson, Associate Superintendent for Operations
Dr. Bonnie Lesley, Associate Superintendent for Instructional Services
Junious Babbs, Associate Superintendent for Administrative Services
Sadie Mitchell, Associate Superintendent for School Services
Mark Milhollen, Manager of Financial Services
Brady Gadberry, Special Assistant to the Superintendent
Dr. Ed Williams, Research Specialist and Statistician
Ann Brown, Federal Desegregation Monitor
Skip Marshall, Associate Federal Desegregation Monitor
and. Gene Jones, Associate Federal Desegregation Monitor. 2federal and food service employees. As with teachers, a lower pupil/staF ratio is considered more favorable with the goal being equity in the staflBng formula. 5. Square Feet Per Pupil. The committee found that the school overcrowding can have a negative impact on student achievement. The Council of Education Facility Planning standards recommends 90 sq. ft. per pupil for elementary schools, 120 sq. ft. per pupil for middle schools and 145 sq. ft. per pupil for high schools. Using 3D Internationals 1995 Facilities Master Plan Study, the committee assessed schools based on the number of square feet per pupil with the assumption that the more space the better. Students in schools below the standard may not have adequate instructional space. 6. Percentage of staflT with a masters degree plus and nine. In a 1990 study. researchers found that Afiican-American student performance improved when teachers had strong language skills, nine or more years of experience and a masters degree or higher. Ferguson, R., Racial patterns in how school and teacher quality affect achievement and learning, In Challenge: A Journal of Research on Black Men (1990). Based on this study, the committee decided to measure the allocation of quality teachers by considering the percentage of teachers at a school with at least a masters degree plus nine years of experience. A higher percentage of being more favorable. 7. Turnover Rate of Certified Staff. Low turnover among certified staff plays an important role in building a strong and committed teaching staff and a strong base of parental and community support. High turnover, on the other hand, often results in an inexperienced teaching staff. See, e.g.. Newmann, F.M. and Wehlage, G.G., Successful School Restructuring (1995). The committee calculated the turnover rate by comparing the number of new teachers at a school 3( (both new hires and transfers) to the total number of teachers at a school. The schools were then ranked based on the percentage of new teachers with the assumption that low turnover was most favorable. 8. School size. Recent studies indicate that school size, like class size, may impact student achievement. See, e.g.. Howley, C.B., Synthesis of the effects of school and district size, What research says about achievement in small school and school districts, 41 Journal of Rural and Small Schools 2 (1989). Small schools promote better personal relationships between staff. students, parents and the community. Student morale tends to be higher because of a feeling of belonging. Teachers communicate better with each other and know students better allowing them to teach in a more individualized way. In assessing school size, the committee simply looked at the each schools enrollment and ranked the schools under the assumption that smaller was better. 9. Computer/Pupil Ratio. The committee developed the computer/pupil ratio as a proxy for assessing technological resources as provided for in the Revised Plan. LRSD has already begun implementation of its technology plan designed to bring the district in line with state and national technology standards. The ratio includes only network compatible computers in schools by September 22, 1998. A higher computer/student ratio was considered more favorable. 10. Per Pupil Expenditure. Pouring money into a school provides no guarantee of improving improved achievement. Even so, per pupil expenditure is perhaps the most commonly used factor for assessing the equitable allocation of resources. The committee calculated each schools per pupil expenditures based on the schools discretionary funds. This excluded expenditures for salaries, benefits, utilities and federal funding provided under Title I and for food 4service. To prevent outliers based on extraordinary expenditures, the committee used a three year moving average for expenditures. 11. Volunteer Hours Per Pupil. Volunteer hours per pupil indicate the degree of parental and community involvement at a school. Authorities recognize the importance of parental and community involvement in school success. See, e.e.. Graue, M.E., Weinstein, T., and Walberg, H.J., School Based Home Reinforcement Programs: A Quantitative Synthesis, 16 Journal Educ. Res. 351 (1983). Volunteer hours by school were obtained from the LRSD VIPS department. 12. Donations Per Pupil. Like volunteer hours, donations indicate the degree of parental and community involvement at a school. Donations may also fill in gaps left due to inadequate discretionary funding provided to a school by the district. Only donations accepted by the LRSD Board of Directors were considered. 13. Exhibit 1 contains the results of the committees assessment of each of these factors for each school in the district. 14. The committee also undertook to determine whether any relationship existed between the resources allocated to a school and the percentage of African-American students attending a school. The committee enlisted Dr. Ed Williams of LRSDs Planning, Research and Evaluation Department to determine if such a relationship existed. Using statistical measures. Dr. Williams combined the ten factors in order to assign each school a composite score. See Exhibit 2, Equitable Allocation Worksheet and Composite School Scores. Dr. Williams then compared each schools composite score to the schools percentage of Afiican-American students. See Exhibit 2, Correlations. Dr. Williams concluded that there was no significant 5relationship between the racial makeup of a school and the amount of resources allocated to the school. Respectfully Submitted, LITTLE ROCK SCHOOL DISTRICT FRIDAY, ELDREDGE & CLARK First Commercial Bldg., Suite 2000 400 West Capitol Little Rock, AR 72201-3493 (501)376-2011 BY
e. istopher Heller (#81083) n C. Fendley, Jr. (#92182) 6CERTIFICATE OF SERVICE I certify that a copy of the foregoing has been served on the following people by depositing a copy of same in the United States mail on this 7th day of October, 1998. Mr. John W. Walker JOHN W. WALKER, P.A. 1723 Broadway Little Rock, AR 72201 Mr. Sam Jones Wright, Lindsey & Jennings 2200 Worthen Bank Bldg. 200 West Capitol Little Rock, AR 72201 Mr. Steve Jones JACK, LYON & JONES, P.A 425 W. Capitol, Suite 3400 Little Rock, AR 72201-3472 Mr. Richard Roachell Mr. Travis Creed Roachell Law Firm First Federal Plaza 401 West Capitol, Suite 504 Little Rock, AR 72201 Ms. Ann Brown - HAND DELIVERED Desegregation Monitor Heritage West Bldg., Suite 510 201 East Markham Street Little Rock, AR 72201 Mr. Timothy G. Gauger Office of the Attorney General 323 Center Street 200 Tower Building Little Rock, AR 72201 7 CD LITTLE ROCK SCHOOL DISTRICT ALLOCATION OF RESOURCES 10-07-98 EQUITY INDICATORS 1. Pupil / Teacher Ratio Less Than 15 2. Pupil / Staff Ratio Less Than 9 3. Sq. Ft. / Pupil
Elem 90, Jr 120, Sr 145 4. 5. % of Staff w/ 9 yrs & Masters Degree Turnover Rate of Certified Staff 6. School Size 7. Computer / Pupil Ratio 8. Per Pupil Expenditure 9. Volunteer Hours / Pupil 10. Donations / Pupil X UI f H '"Mtoi-jraNM ILITTLE ROCK SCHOOL DISTRICT ALLOCATION OF RESOURCES 10-07-98 HIGHSCHOOLS ...... CENTRAL" ....................... hall" FAIR ...................................... McClellan " ' ' ..... PARKVIEW TOTAL .................. .......... JUNIOR HIGH SCHOOLS......... DUNBAR ................... FOREST HEIGHTS PULASKI HEIGHTS SOUTHWEST HENDERSON'"........................ CLOVERDALE MABELVALE - . - MANN fOTAL ....... ELEMENTARY SCHOOLS BALE - ..... BRADY ............ BADGETT ....................................... McDermott baseline........................... FAIR park .............. forest PARK ...................... CHICOT .................. WESTERN HILLS ............. P/K K 34 7 0 0 35 is 31 35 36 35 41 0 OCTOBER 1,1997 ENROLLMENT 1-12 TOT TOT-P/K BL WH OTH TOT % BL % WH % OTH TOTAL F.T.E. TEACH F.T.E. PUP-P/K I STAFF PUP-P/K /teach 1821 783 '2935 911 '5207 771 648 767 510 72^ 622 506 858 5406 1855 "790 '7F>1 "935 '911 5248 1855 790 757 "935 911 5248 1101 '561 612 790 464 3528 705 179 137 49 50 8 ' 121 "24 403 1545 44 175 1855 '790 757 935 911 5248 59% 71% 81% 84% 51% 67% 38% 23% 18% 13% 44% 29% 3% 6% i% '3% 5% 3% 147.94 94.90 '82.50' '98.10 89.20 512.64 100.14 62.70 53.20 65.90 59.40 341.34 12.54 8.32 9.18 ' 9.53 10.21 10.24 18.52 12.60 14.23 14.19 15 34 15.37 JEFFERSON CLOVERDALE DODD" MEADOWCLIFF KING GEYER SPRINGS 36 I 71 I 35 51 "56 39' 54 54 "36 57 '59 '39 58 72 24 "40 92 40 276 298 '163 423 2234 176 '373 443 76 55 04 00 92 95 241 771 648 '767 5i"6 "'724" 622 506 '858 5406 648 "'767 '510 724 622 '506 858 5406 442 "452 437 426 624 552 380 "446 759 282 178 315 ....65 .....83 36 119 '375 1453 47 18 15 "l9 17 34 7 37 194 771 648 "'767 ''510 724 622 506 858 5406 84% 86% 89% 75% '52% 70/ 57% 27% '41% 13% 11% 6% 24% '44% 27% 6% 3% 2% 4% 2% 15% 'l% '4% 4% 70.20 73.90 "76.80 60.00 '76.90 63.90 61.30 81.90 564.90 48.80 51.30 56.30 42.40 '53.30 44.80 ''41.90 58.30 397.10 .10.98 8.77 9.99 8.50 9.41 9.73 8.25 10.48 9.57 15.80 12.63 13.62 12.03 13.58 13.88 12.08 14.72 13.61 362 372 233 '477 323 248 430 537 315 513 512 224 332 658 316 '354 "202 "477 288 212 '430 "502 '315 513 476 224 332 587 281 265 235 214 267 188 205 370 222 227 469 145 263 354 237 71 ""94 ..19 181 " 38 50 219 "121 91 279 30 74 57 279 66 26 43 23 18 10 6 46 2 7 13 5 12 25 13 362 372 233 aH 323 248 430 537 315 513 512 224 332 658 316 73% "63% 92% 57% 83% 76% 48% 69% 70% 44% 92% 65% 79% 54% 75% 20% 25% 8% 38% "12% 20% 51% 23% 29% 54% 6% 33% 17% I 42% I 21%! 7% i2% "6% 5% 6% 4'% 1% "9% 1% 1% 3% 2% 4% 4% 4% I '2:20 36.2_O '28.30 43.30 36.90 27.00 38.00 59.'2'0 29.30 44.00 41.10 30.66 32.60 70.22 34.00 23.30 20.30 15.30 26.90 18 70 13.90 23.00 29.40 17.10 27.10 24.30 17.30 18.50 40.00 16.80 7.75 9 78 7.14 11.02 '7.80 ' 7.85 11.32 8.48 10.75 11.66 11.58 7.47 10.18 8.36 8.26 14.03 "17.44 13.20 17.73 15.40 15.25 18.70 17.07 18.42 18.93 19.59 12.95 17^95 14.68 16.73. l'ttle rock school district allocation of resources 10-07-90 PULASKI HEIGHTS ROMINE WASHINGTON WILSON .................. WOODRUFF MABELVALE TERRY FULBRIGHT OTTER CREEK WAKEFIELD WATSON franklin GARLAND MITCHELL ROCKEFELLER RIGHTSELL " ' BOOKER CARVER GIBBS ........................ WILLIAMS TOTAL GRAND TOTAL ........ P/K 36 53 18 '34 '1'6 36 12 18 18 53 18 704 704 K 40 7'62 '83 ' "54 46 54 7'5 69 '36 "52 " 73 ' "34 ...'37 53 '39 '76 39 60 <884 OCTOBER 1,1997 ENROLLMENT 1-12 424 230 524 '290 '210 337 "436 426 '292 '321 '384 315 j87 '299 TOT 464 7328 7660 3'62 284 192 _"'521 536 "419 11583 407 '"511 495 ....328 "'373 493 271 '_^'242 '465 '249 ''597 ' 596 '311 479 14171 TOT-P/K 464 292 "607 344 ....... 250 7 391 .......5'11 495 ^328 373 Z_^^57 392 253 '224 352 -1231 597 .....' 596 ' .......3i'l ........479 '13467 BL 254 206 7352 237 201 299 235 240 151 322 44'1 7427 253 223 "231 234 300 "312 161 240 9335 WH 193 '213 "53 75 92 243 246 167 32 4 0 24 3 ......9 138 ' 9 7261 259 'Y33 214 4151 OTH 17 ' 44 95 12 8 16 33 9 10 19 12 ...13 15 io 30 6 28 25 17 ' 17 685 TOT 464 ' 328 660 362 .....284 407 ""511 495 328 373 ' 493 464 "271 "242 405 249 ....597 596 311 479 14171 % BL 55% 63% '53% 82% 71% ' 73% 46% 48% 46% 86% 89% 92% 93% 92% 59% 94% 52% 52% 52% 52% 66% % WH 42% '24% '32% 7 15% '26% "23% "'48% ' 50% 51% '79% '8% "5% "4% "34% '4% 44% 43% 43% 45% '29% % OTH 4% __i3% 14% "3% 3% 4% 6% 2/o 3% 5% 2% 3% 6% 4% 7% 2% 5% 4% 5% 4% 5% 1925 221'96 24825 _^21 16622 7149 1054 24825 67% 29% 4% TOTAL F.T.E. 39.20 39.10 TEACH F.T.E. PUP-P/K / "oo.io 38.30 7' 32.40 .......40.60 ''47:26 51.90 30.10 7 36:37 4'3.75 73.90 .....47.30 44.20 79.90 39.50 63.70 63.90 40.30 52.30 1,576.34' 2653.88 22.90 23.00 46.60 23.10 17.80 7'23.90 28.20 28.80 16.60 20.50 '25.90 36.50 21.80 21.90 32.90 21.00 44.50 39.20 25.30 31.10 883.40 STAFF 11.84 7.A7 7.66 8.98 '7.72 9:63 10.83 9.54 .10.90 10.26 10.45 '5.30 '5.35 "5.07 4.41 5.85 9.37 9.33 7.72 9.16 8.54 PUP-P/K /TEACH 20.26 12.70 13.03 14.89 14.04 16.36 18.12 17.19 19.76 18.20 17.64 10.74 11 61 10.23 10.70 11.00 13.42 15.20 12.29 15.40 15 24 1621.04 9.09 14.07 II ... L'TJLE ROCK SCHOOL DISTRICT ALLOCATION OF RESOURCES . _ 10-07-90 ar'ea high schools-------- CENTRAL ---- ------------ haLl 7------------- FAIR _ mcclella'n 7 PARKVfEW TOTAL ------------------------ Junior high'schools DUNBAR............. forest HEI'g'HTS --------- PULASki hei'ghts ^UTHWEST HENDERSON cl_overdaLe_'..... mabeLvale_ MANN ...-------------- enroll 10-1-97 SQUARE footage SITE ACREAGE SQ FT/ ENROLL 1,055 '790 "'7'57' ...935 ...911 5'240 266,023 152,346..... 132,266 129,606 7166,477 047,000 16.50 1^31.16 50.00 '"2'9.'6'6 36.06 157.26 _ 143.04 '7 192764 _717'4.75" 102.7'7 ''i6"i740 ...... ELEMENTARY SCHOOLS bale --------------- BRADY'' ... BADGETT -------------------- McDERMotf baseline FqRjST_PARk CHICOT.......... wester'n'hills JEFFERSON'................................. CLOVERDALE bODb ------------------------- MEADOWCLiFF Ki^7..... ............. geye>'spr'ings PLiLAS'ki'H'EJGHTS .......... ROMINE.................. 77} '640 767 510 7 724 ' 622 "566 050 '5,4O6 99.397 70,207 73,216 02,968 '' ld3.212* 01,097 '6'2,'63'6 113,013 606,020 5.00 rjs.oo 4.00 "moo' ''4'6.'36" 7 ^66 12.66 '12.29 1'43.65 120.92_ iO0'4Y '95'46 'l'6p'6_ '142756 131.67 122.60 131.72 '126.90 "362 ~~'372 233 '^A77 ' 32'3 7'246 436 753'7' 315 '7' 513 ' 5'1'2 224 7332 '7650 '316 "' 464 '' 320 33,626 7735.259 ' 23,404... 7'40.020 L30.455 ' 20,06'7 731,914 '" ' 59,607 ' 7'10,911 _ 73 346 33,263 ' 46,712 736,931 75,000 ' 41,7'66 50,252 10.00 '6?26 'l'6?00 -'19 2.10 JO.'40 14.66 ^2^00 0.00 5.56 9.6O 4.56 4.'36 3'.o6 92.09 9747 16045 100^67 42.314 I 20.00 ___156.21 _ iio-^0 3'4.64 12 o^lpo -.._1 34.97 _200?54 ~ Hi.24 _ 1^3796 7 '13Z2'2 "125.54 129761LITTLE ROCK SCHOOL DISTRICT 'ALLOCATION OF RESOURCES 10-07-90 ENROLL WASHINGTON..... VyiLSON _ ..... WbobRUFF mabelvale"' terry'^ FULBRIGHT ....... OTTER CREEK WAKEFIELD... ... WATSON franklin""...... g'arland MitCHELL*-" RbckEFELTER"....' rightse'll ..... BookER.... CARVER ....... ' GIBBS.......................... WILLIAMS........... total ....... JO-1-97 " 660 2^ 362 204 407 .......511 ...495 ' 320 373 493 .....464 -271 ~ 242 465 249 .....597 596 311 479 1'4 J 71 SQUARE FOOTAGE 09,000 37,075 30,66'0 55,568 .... .. I .^'O92 36,551 37,395 5'3,64'6 68,500 38,632 39,200 64,561 37,630 - ... ? 24,530 61,695 37,237 47,200 1.630,565 site"' acreage' " 5.96 zi'o 16.00 7 15.66 ' 13 00 8.90 y 2 ' ~ 0.20 ' "IZ26 1060 22.7O y 4.20 ........"6.30 2.10 13 00 .. 1200 5.00 15.00 305'90 SQ FT/ 'enroll i3'^06 72 102.42 2^ 133.00 2 J 0 ^5 3 00.67 "'.135714 .7 iii 'i' ~_1O-25 109722 147.63 2142'.55_ lei.'g'o 7i 59^4'1 151'12 124.04 103.52 119.73 9054 '115^06 GRAND total 24,825 3,163,601 606.75 127.44 IHIGH SCHOOLS ...... CENTRAL...... ...... f'^r McClellan PARKVIEW total...................... JUNIOR 'HIGH SCHOOLS DUNBAR.......... forest'heTghts PULASKI'HEIGHTS....... southwest" HENDERSON 2l?ver'dale ... MABELVALE MANN' ...... -T.P.'iAL ELEM EN'TA'rY'schools BALE b'rad'y BADGETT .... McDermott ba'selii^e fair park Fbj^ESf PARK ..' CHICOT......... weste'rn'hilTs JEFFl'RSbN' CLOVERDALE Do'bb............... ............. -----little rock school district . ------Z^LLOCATION b'F RESOURCES ------------------ 10-07-98 -------- 'enroll YO-1-^7"' ...masters +'9 'teach 'F.tyE
790' "~757" % 935 '"911 "5,'248' "77? 64^- 707 ' 5'10 724 ...627 "506 858 5
4d6 I 362 2. 372 2'33 477 _ "37" J^a' 430 '"315 51'3 "224 ''512' 56 32 '^'30 '~29 '35 102 23 " 23 J 22 '19 220 ' "14 J "id "'30 "16'4 ' 14 J 8 '9 'Ti 10 '11 14 'io 20 13 9 __l'07'i4 '66
7d' "2"5'7.2j '7d\'9O '365.34 52.80 54.30 '59.30 474'0 ''57.3 d 44.90' "6Z3'0 424.10 25.30 '2Z30 '29.40 "15.90 '25.dd 31.90 J9.'ld' 29.'6d' 27od 197o 1 -12% " 41% '"55% 50% 44% "'47/
7'7% 42% "_''"35% 2'9% ^24 8% ' 39% 2'55% ~07% ' '46% SdJ/o '"63/o '44% '44'% "72% 68'% 49% "47%I -___little rock school district ___....ALTOpATION OF RESOURCES....... ___________ 10-07-98 ............. _ ENROLL ^masters + 9 TEACH MEADOWCLIFF"... KING .---------------.. GEYER springs PULASKI HEIGHTS ROMINE -- WASHINGTON WILSON.....--------......... WOODRUFF MABELVALE terry FULBRrGHT ottercreek WAKEFIELD-----.......... WATSON franklin -- garland -...- mitchell' R^_kef|ll|r rightsell BOOKER CARVER gib^s ---......... \MLUAli^' TOTAL __grand TOTAL 10-1-97 332 658 316 464 328 eeo 362 284 467 ^sli 495 328 373 493' ...464 _ 271 2 4 2 _2~'465 249 597* 596 2_'3il 479 147171 24.825 % 11 17 16 12 10 17 19 6 6 9 15 11 16 11 16 4 6 10 _ 23 18 l 1 2i 426 772 F.T.E. _2O75O' 43.00 _J878O 25.46 25.00 50.10 25.10 19780 25.90 30770 31.30 1860 "22756 28740 38.50 2380 5'4% j40% ' 53% T7% "40% '34% 276% " 36% '223% 29% 2223.90 342790 2^3.66 47756 ...42776 48% ....59% 71% ...39% 26% 2' 1'7% 25% 29% '39% 24'8% 42% -?,7-36 40% 33.50 962
86 1,752.24 63% 44% 44%1997-98 SCHOOL CENTRAL HAL^ PARKVIEW ^ A. FaTr McClellan I .yTTLE ROCK SCHOOL DISTRICT ____OF RESOURCES __________ 10-67-98 ......." ZE zrzEziz. --------jo.?dooas a % of total ... HENDERSON MANN .... d'unbar ....... rj??' PUEHGT^jr. SOUTHWEST mabelvaleJR. JR.' badcett ^^E^Z baseljne~ BRADY c^ver" CHICOT ^lom^Rdale DODD ......... NEW Zl? jZ 7~ 10 M' 4 9 Zl 6 g' 'd' ~2 'd' 5? 4 "e '9 5 2 5 T 2 d TOTAL 108 'ed 73 259 iT 382 58 66 5Z. 59 J 4 "so" 440 21 '28 '23 49 25 44 39"' 23 '20 % "15% 18% 10% 12% 14% 14% 7% '14% 16% "Td% 15% ''l'4% 'ji% 14% 12% 19% 21% '39% " io% "8% 'm ' 8% 9% '0% ......little ROCK SCHOOL DISTRICT ... allocation OF RESOURCES ' '"16-07-90 1997-98 Teachers now to school a i:z' as a > of total fair park FOREST PARK FRANKLIN-........ Fulbright" GARLAND G. SPRINGS GIBBS.............. KING............................ Jefferson'....... mabelvale MCDERMOTT .. MEAbowCLIFF mtchell .. otter CREEiT.... PUL. heights' .... rightsell ?P.77epeller ' ' ROMINE ..... terry .. WAKEFIELD WASHINGTON wa'tson ... wiTlLUs' WILUAMS wilso'n wdODRUpr'......... 4 -2 '5 4 ....1 "4 2 3 0 .... '3 "'3 -1 3 '"3 Ji '''o~ 4 ... "e 122 20 739 41 .7731 25" ..... 23 20 45 . 33' 7 ~29 73 ....... 25 ' 77 26 "23" ..7 20 ' 24 -7739 * 21 32 27' 7'32' Z -. 35 ' 23' .....2^' ' ios'f 20% '5% "......5% ......6% 20% "" 17% 4% 79% ........9% 7% "'15% "71'2% 31% ""4% 11% 13% ' '18% '14% "6% "'J1% 1% 13% 0% ..11% ' 4% '21% ' 12%.........SCHOOL DISTRICT ' ...._..ALLOCATIO'N of RESOURCiES ' HIGH SCHOOLS ........ CENTRAj. HALL 2. ........ ^^"^1 1 McclelLan PARKVIEW......... total" JUNIOR HIGH 'school^ DUNBAR forest HEiGHTS PULAS^kl HEIGHTS SOUTHWEST HENDERSON CLOVERDALE.......... mabeLvale ... MANN.............. ............... fOTAL....... en'rolL' 10-1-97 1,855 '790 P/K STUDENTS 757 _ _935 91 i 57248 elementary schools BALE.... BRADY ...... BADGETT ~2 McDermott ^aseline FAIR PARK.......... FORES'f PAI^k....... CHICOT........................... WESTERN HILLS......" JEFFERSON CLOVERDALE ' DODD 10-07-98 ' adjusted' ''16-1 enrol'l NETWORi^BLE COMPUTERS.. PER/ 2 a'dj pupTl ' 1,855 _ 266 1 1" 935" 2" gii 57248 75 ....2 56 2 1"J77 99 578 2 6 03^' _676949 _0.296_3 071087 ....67iioi - 64^8 5^i6 '724 ''"622 '566 'sse 5,406 11\ ''648 767' "516 7^24' 622 566' "858 5,406 27 253 30 21 174 -22 35 414" o.dsso'" 6.0818 26-639i" .. 6^0529 "6.2463 26.0354 0.0692' _6\O536' ^.oyeT ___362 372 233 2 47r" 323 " 35 is 'sT __2482 ~ 430 2 2_~537 1 513 2. 51'2 2~ 224 35 36 35 36 _ 221 -324 ' 2_2O2..... - ^2 288' 2 212 2'436 56'2 2 _ "3i25' - '5l3' ' " 47'6" ' 224 33 "6.1669 - 3 2 12 13 - -J 2 126 ' 139 " 671162 2 0"6l49j 2676252 6.6164 2 6.6047 6.646'5 672769 3i a6984 24 46 13 _O.'6468 0.0040' 0^0580 '........little rock school district .....allocation of resources *" ENROLL 10-07-98 P/K MEADOWCLIFF KING ............... GEYER SPRINGS ' ' PULASKI HEIGHTS....... ROMINE............... WASHINGTON ....... WILSON ...... .......... WOODRUFF MABELVALE TERRY ......... FULBRIGHT....... OTTER CREEK ...." WAKEFIELD' ............ WATSON..... F_RAN'kLl'N7"..... GARLAND ......... MITCHELL ROCKEFELLER........' RIGHTSELL BOOKER T carver ' GIBBS'..... ................. WILLIAMS 2to't'al ........ ...... 22i 2ZZ. -Z^^NiyTOTAL ------------- _ _ fstUDENTS' T ADJUSfED _ 332 72 2858 316 7464* "328 7 660 ' 7362 284 2 7467' 2 511 "2'4os " '328'' 22 373' _ 2?93' 2J84 y 271...... .....242 7 19.6 2'72'19 27597 7 596 _ 311 ' _ 3_9 '14,171' 24,825 JiEri/VdR'KABLE ' per/ - ----------------------rCR/ r-y?.?LL ___computers ADJ PUPir 71 35 36 53 '18 34 ie 36 "ll "<8 ' J 8 18 704* ....704 332 7 '587 _Z 26'l' 464 7 292 "607 "3"44 2 "25'6' ' ..391 .....'511 .....'495 '2_ 828 373 457 ' ' 392 7 "253' ' 224 7 352 " '231 "'597 23'96 311' - 2 13'467 4 7' 2 23 ' .... 37 7 ' 12 .......''35 ..........5 .......38 2 '10 15 ' 7..5 3 67 61 ' 2 2 9 ' 15 7287 7 28 ' -3 2 2 "34 "'81... 2..43..... 1,048 _ 0.0120 6.0034 6.0'019 6.'67'97 0.0411 27o O5'77 7 6.0930" " o"o2o6' "0.0972 276.6'196 "2 2 6 0363 2_ 6 015'2 " " 0.0080' 2276 1^66 ' ' 0.1556 0.0356 0.0670 '6 2472 ""6.1212 '267673'7' " 6.0576" ' 7 6 2"6"O5 2 "6.0898 '0.0778 "24J2Y 2,040 0.0846 ".....LITT'-E rock school district -.-'^.kLOCATION OF RESOURCES.......... ' "16-67-90........................ enroll Ei area high schools CENTRAL........ ........ HALL ......... FAIR McClellan .......... PARKVIEW total" ' " ~... id-i-'97 . JENROLL average ' 10-1-96 i6-i-95 expense '''97-90 JUNIOR HIGH SCHOOLS ~ '~ DUNBAR forest heights......." PULASKI HEIGHTS SOUTHWEST .... " HENDERSON ............ CLOVERDALE mabelvale ........ MANN .................- TOTAL ......- ELEMENTARY'sCHbOLS bale'2' ..................... BRADY ...... BADGETT ----------- McDermott baseline : FAIR park .............. forest PARK..................... CHICOT WESTERN HILLS" ..... JEFFERSON ...... CLOVERDALE . ' * DODD....................................... MEADOWCLIFF.... KING ' ' ----------------- GEYER SPRINGS^ ....~ ' PULASKI HEIGHTS ".............. '"1755 2 '" 790 ....... ' 935 ' - ^11 5748 :__7712 _ 640 _ 3^67 510 ' '724 2 622 2566 ^Joso' 5.466' ~~ 36f __372 233 Aii ' 323 __2'I8' _ 430 537 315' 51'3 512 224 '33'r '6'5'8' ''3'16' '464 1777 023 ' 814... 926 _928' " _9'05 964 ~ 1.741 '5.2'19'"' 775 055 5,103 732 630 ' 759 705 594 " 741 "' ____639 _ - Jp o 054 5,^06 781 61'2 792 ""669 ' 491 847 expe'nse '96-97 "'' expense ' ....95'-'96 " avgerage PER PUPIL ' ... 847 '"825 " '"'922 002 '5,21'7 7'59' '"679' 778' 572' ' "752 623 408.... 853' .. -9.i23 ' "5^565' " 375 3712 _ " 219 ' '"439 - 1295 ' .... 2 '2 497 2 566 ' J42 '" _8Z3 Z 622 'J347 ' 394 216 ' 407 11?'35.84 ' i 03,975.33 41,905 00 46,432.63 '52,900.12' ' i03?307.37 43,607,37 _ 46,'352.94 52,090.65 __1^1
82477 2 75.585.60' 2 235.666^28 82?l216.24 567.946'26' 56,966.09 55.462.41' 47.079.25 47,643.65 li?j84.63 2i i i'.'468.23 -..V8j215J9 23i.16'9?5i ' 49<811.54 57.409.'34'' 54d,668?0i . 59.34 55.58 "57.73 120.94 262.20 '103.64 4'5'4 "2 2'76 2 -335 99^ _ 453 2531 2 ' 3io '406 2361 ' 379 " 221 ' '484' ' '317 22258 438' Z-5'2 - 3^ "sor " ?52 _J88' '_312 441 '666^<nn 1- 87.409.34 2"'5671975 4i'F6Ti? -- --- ---81976 "36797:30 ..jOIJI _ 30.302.90 41.448.20 27.59373 99.000.60 27.060.92 33.266.51 '32.'611.43 03.409.06 23.210.63 1^082.63 ....25,72i
42 236.746.63 28O.334.54' _553.692J7 582.185.6'2' 75.11'4.26' 23728.'47 ~ 26'.748.49 " 186.065?6O ' 484,456'.6'7' -..?'.9'i'i.:9i 28.666 59'' U 27.378.97 25.556.'59 26.583.55 1'^-'9^^-74 16.544'22 33.611.51 29?i26.'53 .23.98O?o6 23.700.96" __^.!l99.i3 ......21.783.16' _?O76977 96.22873 '2i75l'?56 23.541.58 32.236.53' '46.756.79 ..... 3f.i 57.22 05.068.00 24.672.01 26.85'6.65' ZZ237''295.59......' 539.911.39 ' ' ""''27.'676?2'5' 2^!?91:72_.. 26.277?6g 14420.27 ______________15.023741 j_____297'69702........ 247717.56.... .?.2.'550.5'6 21.158.93........... -??..583.6i 21226730.35 '' ' 88'62O.95 54.693.37....... ................... 20.990.08..........2ii07 25....... -8'l9?_?-9* ___26.416.39 33J28.'O3 35.366.67 36.637.67 i5.i59
io " 20,413.94 22,919.38 29'667.66 14.72^8'9 31,3'75'15 33,860.27 16,765.31 .-^9./?9O.48 40,24 3.05' --2^299^99^ 22,'59'3.16 '24.6'4'391 36529.64 ''27.7'79.'66 '22722.96 "37,463.1'1....... 3'8,9"85.81 26.795.54 '''26.466?i7' 24.350^67 25.900.89 74.56 '54.05 52.40 54.47 114.14 39.58 54.98 78.19 90.00 '74.93 69.33 60.07 '60.43 "77.09 '02.12 59.90 107.60 " Q7.22 6279 69.35 66.10 61.34 64.50 04.64 50.69... .yPLE ROCK SCHOOL DISTRICT ___allocation OF RESOURCES 10-07-98 ROMINE ........ WASHINGTON WILSON" WOODRUFF.............. MABELVALE ' . TERRY ..................... FULBRIGHT OTTER"creek WAKEFIELD 7.... WATSON" franklin" garland........... MITCHELL.................... rockefeller....... righ"tse"lL" ........ BOOKER...................... CARVER 7.......... GIBBS" ..................... WILLIAMS" total 'grand TOTA'l' ' ' 1'6-1-97' " ___72. "7_^660 "' 362" ENROLL _______ ENROLL A'VER'AG'E ' '"' 10-1-96 16" 1-95" ....-...... ' 284" '*07 511 ''"495 '7'328 ' ' 373' I' J93' ''_46'4 '7 271' 7242 /7 ^05 Z^-ig 597 596 LjJl 479"' 'I4:'l7'i' 304 708 '362 268 '418 515 566 302 '656 '304 254 ' ' 24:625 - ' expense '- - 310 _' ' 4'36 479" J 32 ' ill " 262 7___436 ' 246 LJL 663 SCM 7 "50'i ' '14,281 ~ "24,986 460 "'536 51'8 ' "3'39 429 444 431 '2'55 "2'57 ' 406 219 604 629 3'67' '508 '14,0'76' ___311 '6"75' "' "369 '269 "7'426 '5'21.... ''2'"56"4' 1-326 ' 413 ' __A12 4'49" ' '" '2'6'0 "254 ' _ ^16 27 230 301 _ 7_ 310 ' 7_ ""'310 ... " '496 ....1'4.174 24,876" ' 24','B96 97-98 96-97 57.735^89 54':492':7'7' 69,699.60' __20,057.11 724:163.46 72 27,444.64 20,234.26 " " 31,602.51 '"21:533.79 65,554.46 ''22,754.90 2'4',449:55 27'.'62O.1B 32,518 83' 33,937:51 20,296.58 -.-23.43^06 ' 26,16i?i 5 "expens'e_ 95-96 average" ...75,i 39.08 62,455"91 52,835.39 23,699.36 ''"20,399?2'3 36:441'.'73' '28:605.10 62,496.51 "22,176:44 '23,01'6.75 30,502.18 29,786.06 -?3'632.57 31,417.53 2^635.10 23'16474'6' 21,488.49 '24,234.20 ---------- . ------ .- 33.049.80____40,511:8'5' " "' a^OOtOO.......""36 547"05 -.1?2J29^27 2iO7
5627o '""Tn^flB "71,392.25 " 7 7'0.763.37 249,49 too "66,506.80 207,109.51 ..... - ----- - vr 59,552.27 '_ ''6'5,810'97" .?5.143.44 7^72298' ....71^906.60 '197.4'1'5.82' 58,'986.35 121.783.15 -t3?'193/87 2 170'340.05' 132,869:5'2 7.13'3,'799'.95 2,024,546.36 3,1'99','8B5767 69,936.75 '127,6'62.3'2 1.786^95.39 2,877J 26.67 217,976.65 ''221'627.82 58,318.66 7" 53,065.76 7121:215.60' 5'o','746:24 ..."91,025739 1:599 376.15 61.270.58 "7127.586.14 -J.:* 326:53 '91.182 17 7'117.742.55 1.803.639.30 AVGERAGE PER PUPIL' 7 200:61 ,92.63 30.03 "05.65 71.21 57.21 62.30 7_ '65.90 '"50.73 "77.43 '7 252.18 __ 245.87 2 283.47 .1 333.19 257.44 212.17 .7 243.28 7 294.14 237.38 127.25 2,575,644.36 '2.M4 2i'B'7n 115.85 II little rock school district ALLOCATION OF RESOURCES HIGH SCHOOLS CENTRAL HALL FAIR McClellan PARKVIEW TOTAL ......... 10-07-98 ENROLL 10-1-97 SERVICE HOURS HOURS/ ENROLL ' 1,855 790 757 935 911 5,248 6,743.75 1,476?6o 4,692.50 4,533.50 " },277.75 10,723.50 JUNIOR HIGH'sCHOOLS DUNBAR ............ forest HEIGHTS..............' PULASKI HEIGHTS .........." SOUTHWEST ........................ HENDERSON ''.............. CLOVERDALE MABELVALE..... ~ MANN .................. total ............... ELEMENTARY SCHOOLS BALE............................................ BRADY............ ....- BADGETT ............' " McDermott" ........ baseline"......... FAIRPARK ------------------ FOREST PA'rk ......''....... CHICOT ....... WESTERN hIlLS JEFFERSON cLoverdale ....... DODD'........... ............. MEADOWCLIFF ........ KING................. ......................... 77} _648 7Q7 510 ' 724 622 506 058 5,406 3,041.00 1,004.50 4.15'7'60 3 400.25 i,'016.25 1,019.00 19,285.00 3O,89TOO 3.64 '1.0'7 "670 '4.85 1.40 3.57 4.98 1.67 5.42 6?96' iJo 2.01 22.48 5.71 362 372 ? 233 A77 '323 240 430 537 315 513 512 224 332 650 2,127.50 833.00 134.25 2'869.50 3,832.50 1,342.50 6,404.50 1,339.75 '1'77375 2,806.75 '291.50 1,276^00 475.50 8,00025 5.88 2.24 0.58 6.02 11.87 5.41 "l<89 2'.'49 5.63 5.47 0.57 570 1'43 12.17LITTLE ROCK SCHOOL DISTRICT ALLOCATION OF RESOURCES GEYER SPRINGS PULASKI HEIGHTS ROMINE WASHINGTON " WILSON .................... woodruff MABELVALE ........... TERRY FULBRIGHT otter creek WAKEFIELD ................. WATSON FRANkUN garland '" .... MITCHELL ROCKEFELLER " RIGHTSELL........... ' BOOKER CARVER.......................... GIBBS.................................. WHJJAMS ............ TOTAL ....... 10-07-90 ENROLL 10-1-97 316 464 320 "660 362 204 <107 611 '65 320 "......... 373 ..............493 464 ......271 242 '05 249 597 596 311 ........... 479 ......"14.171 SERVICE HOURS 5,713.75 3,126.25 4,110.50 '2,701.75 ....... 121.50 i, 114.75 116.00 5,401.00 7,606.25 4,043.25 449.75 2,267.5'd <024.75 1,327.75 1,013.75 7,286.00 "5,101.25 3,644.50 19,087.75 17,374 50 '9,329.75 137,16550 HOURS/ ENROLL ' 16.00 674 <2.56 _ '09 '_0.34 "<93 0.29 10.73 15.37 14.77 21 4.60 "<93 4.90 4.19 17.99 20.49 6.10 32.03 55.07 19?10 9.60 GRAND TOTAL 24,025 106,780.00 7.52 II .....little rock school district ALLOCATION OF RESOURCES HIGH SCHOOLS ..... CENTRAL .......... HALL""'............................................ FAIR.........-----.............................. McClellan ........ PARKVIEW'-------.................. total".......... ..... JUNIOR HIGH SCHOOLS DUNBAR ..... forest HEIGHTS " pula'ski heights^ SOUTHWEST ....... HENDERSON"..-...................... CLOVERDALE" ............... mabeLvaLe .... MANN "....... -........ TOTAL ......... -.... elementary scHdoLs BALE"' 2 ............. ....... BRADY BADGETT.... ....... m^ermott baseline.. ......... FAIR PARK FOREST PARK .....' CHicbt............................................... WESTERN HILLS ................. jeffe'rson ...-..... CLOVERDALE .......---- DODD ........... -...... 10-07-98 enroll"" 16-1-97 1,855 ....790 757 " " 935 """911 5,248 771 648 767 510 724 _ 622 "506 858 5,406 '"'362 7372' " '233 ' J 323 " 248 430 "537 "315.. "513 512 '224 donations 8,980.00 5,343.00 900.00 400.00 3,45000 19 073^00 A866.06 ' ""6O'.66" 1,100.00 915.00 750.00 10,691.00 3,375.06 3,233.88 12,975.94 1,556.00 25O
o6 10,742.04 2,135^42 325.00 _ PER 'pupil 4.84 676 i."l'9 0.43 3.79 "3.63 "iofe" ""6J2" ...1.52 i.8i 0.87 1.98 9.32 869 27.20 J4.86" i.oi 24?98 3.98" 0.63I LITTLE ROCK SCHOOL DISTRICT ALLOCATION OF RESOURCES _____ 10-07-98 MEADOWCLIFF ............ KING ........... GEYER SPRINGS .......... PULASKI HEIGHTS......... ROMINE ............. WASHINGTON'....... WI^ON ................. ............ MABELVALE'.... ....... terry"'.. FULBRIGH't ............... OTTER CREEK ....... WAKEFIELD...... WATSON .....----- fr'anklin ...... garland .......... MITCHELL ROC'keFELLER............ RIGHTSELL BOOKER carver gIbbs wil'lIams 'total grand tot al ENROLL 10-1-97 332 658 ....316 '64 328 ...... 660 362 284 407 '"'5'il 495 ...........328 '373 '.....493 .......''464 271 242 - ZL_ ?65 249 ''' '259'7 '596 ZZ 511 _'179 '14,1'71 24,825 DONATIONS 4,400.00 150.00 1,686.94 3,377.16' 3,135^05 ' "77O'.6o 1,'29<.6o 2'395.00 ... 55.00 3?46o.6o 3,285.60'' 2 1,'255'/66...... 7,600.00 100'50 13,066.00 1,356.00 8408.00 ' 506.00 9O.745.'93 120,509.93 PER PUPIL <3.25 0-23 7'..5.34 1...'7.28 ........9.56 '<17 3.57 5.88 0.11 10.37 a.'a'i '^2.'55 16.38 6.37 '53?72 3^3 33.77 1.61 6.40 4.85. I 1. PupiVTeacher Ratio Equitable Allocation Worksheet 7 6 5 4 3 2 1 (10.71) (11.54) (12.97) (15.5) (17.67) (18.72) (19.68) 2. Pupil/Staff Ratio 7 6 5 4 3 2 1 (5.17) (5.80) (7.76) (9.25) (10.40) (11.34) (11.76) 3. Square Feet per Pupil 1 2 3 4 5 6 7 (69.13) (88.29) (101.11) (125.19) (142.56) (163.89) (188.29) 4. Percent of Staff with a Masters Degree, plus, Nine Years of Experience 1 2 3 4 5 6 7 (23.9) (35.5) (44.0) (52.75) (63.4) (69.65) 5. Turnover Rate of Certified Staff 7 6 5 4 3 2 1 (1.80) (4.00) (7.00) (11.00) (15.00) (20.10) (29.20) 6. School Size High School 7 6 5 4 3 1 (911) (1395) 1 Middle School 6 (506) 5 (538) 4 (686) 7 3 2 1 Elementary 7 6 7. (231) (246) 5 (315) (373) (495) (596) 1 (658) Computer/Pupil Ratio 4 3 2 1 2 3 4 5 6 1 (.0062) (.0118) (.0351) (.0625) (.0981) (.2410) (.2695) 8. Per Pupil Expenditure 1 2 3 4 5 6 2 (53.14) (54.93) (59.93) (70.28) (180.69) (263.80) (289.34) 9. Volunteer Hours per Pupil 1 2 3 4 5 6 7 (.3125) (.579) (1.90) (5.195) (12.10) (19.58) (27.73) 10. Donations per Pupil 1 2 3 (.00) (.00) (.0275) 4 5 6 2 (1.71) (8.34) (17.24) (30.81) EXHIBIT IComposite School Scores 27- Cloverdale Elementary 28- 29- Terry 30- 31- 32- Cloverdale J.H., King, Pulaski Heights Elementary 33- Dunbar, McDermott, Western Hills 34- Pulaski Heights J.H., Jefferson, Wakefield 35- Central, Southwest, Meadowcliff 36- McClellan, Forest Heights, Mabelvale Elementary, Washington, Woodruff 37- Badgett, Forest Park, Fulbright, Watson 38- Otter Creek 39- Henderson, Mabelvale, Baseline, Booker, Carver Fair Park 40- 41- Mann, Garland, Williams 42- Hall, Brady, Chicot 43- J. A. Fair, Bale, Geyer Springs, Wilson 44- 45- Parkview 46- Romine 47- 48- Franklin, Mitchell 49- Dodd 50- Rockefeller 51- 52- Gibbs 53- 54- Rightsell 7 6 5 4 3 2 1 A A a 0 27.00 32.00 34.00 29.00 36.00 33.00 38.00 41.00 35.00 43.00 37.00 46.00 39.00 49.00 42.00 52.00 45.00 48.00 50.00 54.00 EQUITYComposite School Scores 27- Cloverdale Elementary 28- 29- Terry 30- 31- 32- Cloverdale J.H., King, Pulaski Heights Elementary 33- Dunbar, McDermott, Western Hills 34- Pulaski Heights J.H., Jefferson, Wakefield 35- Central, Southwest, Meadowcliff 36- McClellan, Forest Heights, Mabelvale Elementary, Washington, Woodruff 37- Badgett, Forest Park, Fulbright, Watson 38- Otter Creek 39- Henderson, Mabelvale, Baseline, Booker, Carver Fair Park 40- 41- Mann, Garland, Williams 42- Hall, Brady, Chicot 43- J. A. Fair, Bale, Geyer Springs, Wilson 44- 45- Parkview 46- Romine 47- 48- Franklin, Mitchell 49- Dodd 50- Rockefeller 51- 52- Gibbs 53- 54- RightsellGraph 7 6- 5 4 3 2 1 3 o O 0 27.00 32.00 34.00 36.00 38.00 41.00 43.00 46.00 29.00 33.00 35.00 37.00 49.00 52.00 39.00 42.00 45.00 48.00 50.00 54.00 EQUITY Page 1Correlations Pearson Correlation Sig. (2-tailed) N % African American-' Students TE.RATIO STA.RATI SQ.FT % Teachers with MA +9 TURNOVER # Students COMPUTER EXPENDIT VOLUNTEE DONATION EQUITY % African American Students TE.RATIO ST Al RATI SQ.FT % Teachers with MA +9 TURNOVER # Students COMPUTER EXPENDIT VOLUNTEE DONATION EQUITY % African American Students TE.RATIO STA.RATI SQ.FT % Teachers with MA +9 TURNOVER # Students COMPUTER EXPENDIT VOLUNTEE DONATION EQUITY % African American Students 1.000 -.325* -.376" .120 -.183 .274 -.257 .122 -.085 -.404" .269 .120 .024 .008 .417 .213 .059 .078 .408 .565 .004 .065 .415 48 48 48 48 48 48 48 48 48 48 48 48 TE.RATIO STARATI SQ.FT % Teachers with MA +9 TURNOVER # Students -.325* -.376" .120 -.183 .274 -.257 1.000 .826" -.554" .826" 1.000 -.455" -.554" -.455" 1.000 .468" .407" -.252 -.285* -.365* .241 .135 .453- .170 .468" .407" -.252 1.000 -.131 .020 -.285* .135 -.265 -.522" -.071 -.152 -.638" -.365* .453" -.226 -.561" -.135 -.239 -.696" .241 .170 .135 .281 -.056 .066 .522" -.131 .020 -.158 -.282 -.017 -.190 -.045 1.000 -.068 -.197 .149 -.061 .258 .097 -.068 1.000 .088 -.091 -.133 -.222 -.259 .024 .000 .000 .001 .049 .359 .069 .000 .630 .302 .000 48 48 48 48 48 48 48 48 48 48 48 48 .008 .000 .001 .004 .011 .001 .122 .000 .362 .103 .000 48 48 48 48 48 48 48 48 48 48 48 48 .417 .000 .001 .083 .099 .248 .361 .053 .706 .657 .000 48 48 48 48 48 48 48 48 48 48 48 48 .213 .001 .004 .083 .376 .892 .284 .052 .909 .197 .764 48 48 48 48 48 48 48 48 48 48 48 48 .059 .078 .049 .011 .099 .359 .001 .248 .376 .892 .644 .644 .180 .311 .682 .077 .511 .553 .536 .368 .129 .076 48 48 48 48 48 48 48 48 48 48 48 48 48 48 48 48 48 48 48 48 48 48 48 48 Page 2Correlations Pearson Correlation Sig. (2-tailed) N % African American-' Students TE.RATIO STARATI SQ.FT % Teachers with MA +9 TURNOVER # Students COMPUTER EXPENDIT VOLUNTEE DONATION EQUITY % African American Students TE. RATIO STARATI SQ.FT % Teachers with MA +9 TURNOVER # Students COMPUTER EXPENDIT VOLUNTEE DONATION EQUITY I % African American Students TE.RATIO STARATI SQ.FT % Teachers with MA +9 TURNOVER # Students COMPUTER EXPENDIT VOLUNTEE DONATION EQUITY COMPUTER .122 -.265 -.226 .135 -.158 -.197 .088 1.000 .429" .175 -.046 .429" .408 .069 .122 .361 .284 .180 .553 .002 .235 .758 .002 48 48 48 48 48 48 48 48 48 48 48 48 EXPENDIT -.085 -.522" -.561" .281 -.282 .149 -.091 .429" 1.000 .512" .195 .655" .565 .000 .000 .053 .052 .311 .536 .002 .000 .185 .000 48 48 48 48 48 48 48 48 48 48 48 48 * Correlation is significant at the 0.05 level (2-tailed). VOLUNTEE -.404" -.071 -.135 -.056 -.017 -.061 -.133 .175 .512" 1.000 .020 .403" .004 .630 .362 .706 .909 .682 .368 .235 .000 .894 .004 48 48 48 48 48 48 48 48 48 48 48 48 DONATION .269 -.152 -.239 .066 -.190 .258 -.222 -.046 .195 .020 1.000 .335* .065 .302 .103 .657 .197 .077 .129 .758 .185 .894 .020 48 48 48 48 48 48 48 48 48 48 48 48 EQUITY .120 -.638" -.696- .522- -.045 .097 -.259 .429" .655" .403- .335* 1.000 .415 .000 .000 .000 .764 .511 .076 .002 .000 .004 .020 48 48 48 48 48 48 48 48 48 48 48 48 Page 3File Information List of variables on the working file Name Position SCHOOL School Print Format': F8.2 Write Format: F8.2 1 Value Label 1.00 2.00 3.00 4.00 5.00 6.00 7.00 8.00 9.00 10.00 11.00 12.00 13.00 14.00 15.00 16.00 17.00 18.00 19.00 20.00 21.00 22.00 23.00 24.00 25.00 26.00 27.00 28.00 29.00 30.00 31.00 32.00 33.00 34.00 35.00 36.00 37.00 38.00 39.00 40.00 41.00 42.00 43.00 44.00 45.00 46.00 47.00 48.00 Central J.A. Fair Hall McClellan Parkview Cloverdale Junior High Dunbar Forest Heights Henderson Mabelvale Junior High Mann Magnet Pulaski Heights Southwest Badgett Bale Baseline Booker Magnet Brady Carver Magnet Chicot Cloverdale Elementary Dodd Fair Park Forest Park Franklin Fulbright Garland Geyer Springs Gibbs magnet Jefferson King Mabelvale Elementary McDermott Meadowcliff Mitchell Otter Creek Pulaski heights Rightsell Rockefeller Romine Terry Wakefield Washington Watson Western Hills Williams Magnet Wilson Woodruff TE.RATIO 2 Print Format: F8.2 Write Format: F8.2 Page 1te. ratio 1 18.52 2 14.23 3 12.60 4 14.19 5 15.34 6 13.88 7 15.80 8 12.63 9 13.58 10 12.08 11 14.72 12 13.62 13 12.03 14 13.20 C
\Program Rles\SPSS\Milhollen.sav sta.rati 12.54 9.18 8.32 9.53 10.21 9.73 10.98 8.77 9.41 8.25 10.48 9.99 8.50 7.14 .. sq.ft 143.84 174.75 192.84 138.05 182.74 131.67 128.92 108.47 142.56 122.60 131.72 95.46 162.68 100.45 1-1 teach 52.00 52.00 48.00 41.00 55.00 29.00 44.00 42.00 35.00 29.00 48.00 37.00 42.00 46.00 turnover 15.00 12.00 18.00 14.00 10.00 4.00 16.00 10.00 7.00 14.00 14.00 15.00 14.00 19.00student# 1 1855.00 2 757.00 3 790.00 4 935.00 5 911.00 6 622.00 7 771.00 8 648.00 9 724,00 10 506.00 11 858.00 12 767.00 13 510.00 14 233.00 C:\Program Files\SPSS\Milhollen.sav computer expendit voluntee donation .04 .07 .09 .30 .11 .04 .04 .08 .24 .07 .05 .04 .05 .01 59.34 57.73 55.58 120.94 3.64 6.20 1.87 4.85 4.84 1.19 6.76 .43 262.20 39.58 74.56 54.05 114.14 54.98 278.19 52.40 54.47 68.07 1-2 1.40 3.79 .00 .00 4.98 1.67 1.40 2.01 22.48 5.42 .96 .58 .00 .00 1.52 1.81 .87 10.26 .12 .001 2 3 4 5 6 7 8 9 10 11 12 13 14 equity 35.00 43.00 42.00 36.00 45.00 32.00 33.00 36.00 39.00 39.00 41.00 34.00 35.00 37.00 C:\Program Rles\SPSSWIilhollen.sav black 59.00 81.00 71.00 84.00 51.00 89.00 57.00 70.00 86.00 75.00 52.00 57.00 84.00 92.00 1-315 16 17 18 19 20 21 22 23 24 25 26 27 28 te.ratio 14.03 15.40 13.42 17.44 15.20 17.07 19.59 12.95 15.25 18.70 10.74 17.19 11.61 16.73 C
\Program Files\SPSS\Milhollen.sav sta.rati sq.ft teach turnover 7.75 7.80 9.37 9.78 9.33 8.48 11.59 7.47 7.85 11.32 5.30 9.54 5.35 8.26 92.89 55.00 21.00 156.21 124.84 97.47 103.52 111.15 64.97 208.54 116.40 74.22 147.63 135.14 142.55 132.22 2-1 53.00 39.00 48.00 67.00 42.00 44.00 10.00 8.00 11.00 8.00 49.00 47.00 63.00 44.00 26.00 48.00 17.00 53.00 9.00 .00 20.00 5.00 5.00 6.00 20.00 17.0015 16 17 18 19 20 21 22 23 24 25 26 27 28 student# 362.00 323.00 597.00 372.00 596.00 537.00 512.00 224.00 248.00 430.00 464.00 495.00 271.00 316.00 C
\Program Rles\SPSSyVKIhollen.sav computer expendit voluntee donation .10 .01 .07 .11 .06 .28 .08 .06 .00 .05 .16 .03 .04 .08 74.93 77.89 212.17 69.33 243.28 107.68 69.35 66.18 82.12 59.90 252.18 62.30 245.87 84.64 5.88 11.87 6.10 2.24 32.03 2.49 .57 5.70 5.41 14.89 3.93 15.37 4.90 18.08 9.32 4.80 .00 8.69 .00 3.98 .00 .00 1.01 24.98 16.38 .11 .37 5.34 2-215 16 17 18 19 20 21 22 23 24 25 26 27 28 CiVrogram Files\SPSS\Milhollen.sav equity 43.00 39.00 39.00 42.00 39.00 42.00 27.00 49.00 39.00 37.00 48.00 37.00 41.00 43.00 black 73.00 83.00 52.00 63.00 52.00 69.00 92.00 65.00 76.00 76.00 92.00 48.00 93.00 75.00 2-329 30 31 32 33 34 35 36 37 38 39 40 41 42 te. ratio 12.29 18.93 17.68 16.36 17.73 17.95 10.23 19.76 20.26 11.00 10.70 12.70 18.12 18.20 C:\Program Rles\SPSS\Milhollen.sav sta.rati sq.ft teach turnover 7.72 11.66 8.36 9.63 11.02 10.18 5.07 10.90 11.84 5.85 4.41 7.47 10.83 10.26 119.73 40.00 4.00 84.88 68.00 9.00 113.98 136.53 100.67 111.24 161.98 111.44 40.00 23.00 31.00 54.00 25.00 59.00 9.00 7.00 15.00 12.00 31.00 4.00 125.54 151.12 159.41 129.01 88.67 100.25 3-1 47.00 39.00 29.00 40.00 29.00 71.00 11.00 13.00 18.00 14.00 6.00 11.0029 30 31 32 33 34 35 36 student# 311.00 513.00 658.00 407.00 477.00 332.00 242.00 328.00 37 464.00 38 249.00 39 405.00 40 328.00 41 511.00 C:\Prooram Files\SPSS\Milhollen.sav computer expendit voluntee donation .26 .05 .00 .10 .03 .01 .07 .02 .08 .12 .25 .04 .02 294.14 44.87 1.61 6229 64.58 71.21 60.43 61.34 283.47 65.98 58.69 257.44 533.19 200.61 57.21 5.47 12.17 .29 6.02 1.43 4.19 14.77 6.74 20.49 17.99 12.56 10.73 .63 .23 5.88 27.20 13.25 53.72 10.37 7.28 33.77 3.33 9.56 .00 42 373.00 .01 58.73 1.21 8.81 J 3-229 30 31 32 33 34 35 36 37 38 39 40 41 42 equity 52.00 34.00 32.00 36.00 33.00 35.00 48.00 38.00 32.00 54.00 50.00 46.00 29.00 34.00 C:\Program FilesVSPSS\Milhollen.sav black 52.00 44.00 54.00 73.00 57.00 79.00 92.00 46.00 55.00 94.00 59.00 63.00 46.00 86.00 J 3-3te. ratio 43 13.03 44 17.64 45 18.42 46 15.40 47 14.89 48 14.04 C
\Program Rles\SPSS\Milhollen.sav sta.rati 7.58 10.45 10.75 9.16 8.98 7.72 4-1 sq.ft 136.06 109.22 64.64 98.54 102.42 133.80 teach 34.00 39.00 52.00 63.00 76.00 30.00 turnover 7.00 13.00 .00 11.00 4.00 27.00. 1' C:\Program Fiies\SPSS\Milhollen.sav studentii computer expendit voluntee donation 43 660.00 .06 92.63 4.09 1.12 44 493.00 .15 77.43 4.60 2.55 45 315.00 .10 67.20 5.63 .00 46 479.00 .09 237.38 19.48 .00 47 362.00 .09 60.03 .34 3.57 48 284.00 .02 85.65 4-2 3.93 .0043 44 45 46 47 48 equity 36.00 37.00 33.00 41.00 43.00 36.00 C:\Program Files\SPSS\Milhollen.sav black 53.00 89.00 70.00 52.00 82.00 71.00 J 4-34 ' FEB 1 4 2000 Data for Equitable Allocation of Resources Worksheet 1999-00 School Year nPQFPRFPinflM UflNITflHIWR /o New Score % Black Score % Black UCoCuntuHllunillgloHy^i^i^Qy^gl yeach/Pupll Staff/Pupil Sq. Ft. Per % Ma Teachers Enrollment Computer Money Volunteer Donate 1999 CENTRAL HALL FAIR McClellan PARKVIEW DUNBAR FOREST HEIGHTS PULASKI HEIGHTS SOUTHWEST HENDERSON CLOVERDALE MABELVALE MANN BADGETT BALE BASELINE BOOKER BRADY CARVER CHICOT CLOVERDALE DODD FAIR PARK FOREST PARK FRANKLIN FULBRIGHT GARLAND GEYER SPRINGS GIBBS JEFFERSON KING MABELVALE McDermott 1 2 8 12 5 7 9 10 11 13 15 16 3 19 17 22 6 18 21 28 31 32 23 24 25 48 26 37 27 30 35 46 20 1 1 1 tl 1 2 2 2 2 2 2 2 2 3 3 3 3 3 3 3 3 3 3 3 3 3 3 3 3 3 3 3 3 17.66 15.54 14.38 16.31 15.96 14.02 14.07 13.92 8.71 9.82 14.1 11.05 14.34 14.45 11.93 12.97 10.94 13.87 13.82 16.69 15.85 9.84 12.74 14.72 11.19 16.21 12.51 16.71 10.56 15.46 13.20 15.00 16.29 12.26 11.45 9.91 10.93 10.97 9.99 9.67 10.22 6.53 7.00 10.16 7.99 10.31 7.46 6.68 6.42 7.99 8.31 8.40 8.83 9.05 6.03 6.69 8.74 6.04 8.61 5.87 8.53 6.72 9.70 7.07 8.39 9.54 130.48 109.52 137,83 99.35 143.89 134.50 89.35 96.34 185.61 187.32 116.16 121.42 134.22 119.41 107.78 170.46 139.57 104.19 117.51 117.03 78.08 230.11 130.62 100.36 141.24 163.15 144.69 128.95 130.66 117.69 122.55 147.01 128.74 0.48 0.37 0.40 0.35 0.53 0.37 0.32 0.42 0.33 0.37 0.29 0.36 0.46 0.54 0.58 0.50 0.42 0.43 0.37 0.39 0.37 0.38 0.60 0.34 0.25 0.47 0.23 0.52 0.45 0.76 0.40 0.19 0.44 0.22 0.43 0.25 0.40 0.19 0.29 0.28 0.22 0.23 0.29 0.35 0.29 0.14 0.14 0.05 0.13 0.21 0.08 0.11 0.21 0.04 0.00 0.00 0.42 0.15 0.31 0.23 0.31 0.19 0.15 0.09 0.20 0.04 2045 1391 955 1192 1157 739 785 760 447 551 705 494 842 196 312 296 534 348 525 510 426 203 221 318 485 410 267 324 285 370 612 378 373 0.0704 0.0891 0.0932 0.2794 0.1201 0.0622 0.0841 0.0697 0.1051 0.3521 0.0837 0.0972 0.0867 0.0432 0.1403 0.0229 0.1498 0.1242 0.1467 0.3017 0.1128 0.1351 0.0215 0.1038 0.1763 0.0585 0.0723 0.1142 0.2842 0.1243 0.0240 0.1139 0.0617 58.07 45.91 63.45 252.21 258.25 76.69 45.66 52.87 64.53 265.43 41.28 52.36 284.92 69.73 77.05 75.49 294.76 71.34 256.03 105.84 75.86 76.45 86.10 67.16 221.61 68.80 240.02 79.03 526.14 67.94 70.37 67.82 69.57 1.97 4.36 2.98 3.70 4.16 9.89 0.16 11.85 2.06 5.70 3.06 0.76 4.71 5.12 5.23 16.64 16.43 3.87 39.33 3.50 3.43 14.05 8.32 22.77 6.85 16.66 7.06 10.61 34.38 38.93 16.35 0.56 40.00 4.15 1.94 0.00 4.74 0.00 3.62 0.00 11.57 0.00 2.18 0.00 0.00 7.65 0.00 3.63 2.76 9.02 0.00 0.00 0.93 0.00 20.99 5.20 39.33 0.41 28.78 3.00 1.27 0.00 1.11 8.17 1.44 19.60 29 25 34 36 44 38 23 36 45 56 25 34 46 45 58 57 57 43 47 39 35 69 60 40 49 43 50 42 62 47 46 36 47 1999 57% 71% 80% 89% 50% 60% 65% 60% 91% 77% 88% 73% 52% 91% 74% 85% 51% 71% 52% 67% 89% 65% 72% 44% 96% 41% 94% 82% 52% 39% 55% 74% 57% 1998 37 47 49 46 47 36 40 39 42 44 36 45 46 41 50 50 43 48 45 47 31 57 44 42 54 45 46 49 60 41 36 41 39 1998 59 81 71 84 51 89 57 70 86 75 52 57 84 92 73 83 52 63 52 69 92 65 76 48 92 48 93 75 52 44 54 73 57 DRAFT COPY 2/11/00 1Data for Equitable Allocation of Resources Worksheet 1999-00 School Year % New Score % Black Score % Black School#Level Teach/Pupil Staff/Pupil Sq. Ft. Per % Ma Teachers Enrollment Computer Money Volunteer Donate 1999 MEADOWCLIFF MITCHELL OTTER CREEK PULASKI HEIGHT RIGHTSELL ROCKEFELLER ROMINE TERRY WAKEFIELD WASHINGTON WATSON WESTERN HILLS WILLIAMS WILSON WOODRUFF 33 34 50 38 39 36 40 47 51 42 52 29 43 44 45 3 3 3 3 3 3 3 3 3 3 3 3 3 3 3 16.19 11.87 17.45 16.36 13.09 10.65 12.26 17.52 15.53 11.22 16.36 16.89 14.54 14.68 13.33 8.78 6.03 10.58 8.82 6.44 4.39 7.20 11.05 9.11 6.30 9.80 9.14 9.14 7.99 7.43 147.14 158.70 104.73 190.37 139.89 161.00 131.41 87.98 111.96 165.38 121.00 164.67 103.06 118.45 134.75 0.40 0.23 0.50 0.63 0.51 0.29 0.39 0.34 0.64 0.32 0.41 0.53 0.71 0.68 0.24 0.11 0.29 0.10 0.05 0.24 0.09 0.14 0.06 0.11 0.13 0.21 0.00 0.06 0.14 0.20 251 247 349 306 269 401 322 515 334 543 445 255 458 313 282 0.0398 0.0742 0.0544 0.1569 0.1416 0.3208 0.1042 0.0485 0.0180 0.1043 0.1834 0.1373 0.0961 0.1186 0.0363 67.07 281.03 60.25 67.36 242.78 483.03 173.45 60.30 69.83 104.40 74.61 69.50 286.99 61.47 84.10 2.39 9.60 11.44 21.44 20.68 49.97 15.97 19.75 0.68 11.42 1.95 9.43 18.62 0.33 6.22 0.00 0.00 3.44 26.14 0.00 5.91 6.72 4.50 19.37 0.00 0.45 20.75 37.51 0.00 0.00 37 51 35 61 59 65 55 31 40 50 38 55 53 41 42 1999 79% 97% 47% 57% 97% 61% 66% 46% 84% 61% 94% 75% 51% 89% 80% 1998 41 56 45 39 60 59 52 34 42 43 43 43 47 50 41 1998 79 92 46 55 94 59 63 46 86 53 89 70 52 82 71 DRAFT COPY 2/11/00 2P/K K ________________LITTLE ROCK SCHOOL DISTRICT __________________ALLOCATION OF RESOURCES _____________________________10-01-99_________ OCTOBER 1,1999 ENROLLMENT 1-12 TOT TOT-P/K BL WH OTH TOT % BL % WH % OTH TOTAL F.T.E. TEACH F.T.E. PUP-P/K /STAFF PUP-P/K /TEACH HIGH SCHOOLS CENTRAL HALL FAIR McClellan PARKVIEW TOTAL MIDDLE SCHOOLS DUNBAR FOREST HEIGHTS PULASKI HEIGHTS SOUTHWEST HENDERSON CLOVERDALE MABELVALE MANN TOTAL ELEMENTARY SCHOOLS BADGETT BALE BASELINE BOOKER BRADY CARVER CHICOT CLOVERDALE DODD FAIR PARK FOREST PARK FRANKLIN FULBRIGHT GARLAND GEYER SPRINGS 0 0 11 34 34 18 36 36 18 35 71 18 35 0 0 40 47 49 78 60 78 75 58 31 39 50 72 62 47 53 2045 1391 955 1192 1157 6740 739 785 760 447 551 705 494 842 5323 145 231 213 456 270 447 399 332 154 147 268 342 348 202 236 2045 1391 955 1192 1157 6740 2045 1391 955 1192 1157 6740 1167 981 760 1066 582 4556 843 306 179 108 538 1974 35 104 16 18 37 210 2045 1391 955 1192 1157 6740 57% 71% 80% 89% 50% 68% 41% 22% 19% 9% 46% 29% 2% 7% 2% 2% 3% 3% 166.80 121.50 96.40 109.10 105.50 599.30 115.80 89.50 66.40 73.10 72.50 417.30 12.26 11.45 9.91 10.93 10.97 11.25 17.66 15.54 14.38 16.31 15.96 16.15 739 785 760 447 551 705 494 842 5323 739 785 760 447 551 705 494 842 5323 447 507 457 406 422 617 360 435 3651 249 254 295 33 110 49 123 380 1493 43 24 8 8 19 39 11 27 179 739 785 760 447 551 705 494 842 5323 60% 65% 60% 91% 77% 88% 73% 52% 69% 34% 32% 39% 7% 20% 7% 25% 45% 28% 6% 3% 1% 2% 3% 6% 2% 3% 3% 74.00 81.20 74.40 68.50 78.70 69.40 61.85 81.70 589.75 52.70 55.80 54.60 51.30 56.10 50.00 44.70 58.70 423.90 9.99 9.67 10.22 6.53 7.00 10.16 7.99 10.31 9.03 14.02 14.07 13.92 8.71 9.82 14.10 11.05 14.34 12.56 196 312 296 534 348 525 510 426 203 221 318 485 410 267 324 185 278 262 534 330 525 474 390 185 186 318 414 410 249 289 179 231 253 271 247 274 344 381 131 160 139 466 169 250 267 16 66 41 249 75 229 85 21 68 58 172 11 233 3 44 1 15 2 14 26 22 81 24 4 3 7 8 8 14 13 196 312 296 534 348 525 510 426 203 221 318 485 410 267 324 91% 74% 85% 51% 71% 52% 67% 89% 65% 72% 44% 96% 41% 94% 82% 8% 21% 14% 47% 22% 44% 17% 5% 33% 26% 54% 2% 57% 1% 14% 1% 5% 1% 3% 7% 4% 16% 6% 2% 1% 2% 2% 2% 5% 4% 24.80 41.60 40.80 66.80 39.70 62.50 53.70 43.10 30.70 27.80 36.40 68.50 47.60 42.40 33.90 12.80 23.30 20.20 48.80 23.80 38.00 28.40 24.60 18.80 14.60 21.60 37.00 25.30 19.90 17.30 7.46 6.68 6.42 7.99 8.31 8.40 8.83 9.05 6.03 6.69 8.74 6.04 8.61 5.87 8.53 14.45 11.93 12.97 10.94 13.87 13.82 16.69 15.85 9.84 12.74 14.72 11.19 16.21 12.51 16.71P/K LITTLE ROCK SCHOOL DISTRICT __________________ALLOCATION OF RESOURCES 10-01-99 OCTOBER 1,1999 ENROLLMENT GIBBS JEFFERSON KING MABELVALE MCDERMOTT MEADOWCLIFF MITCHELL OTTER CREEK PULASKI HEIGHTS RIGHTSELL ROCKEFELLER ROMINE TERRY WAKEFIELD WASHINGTON WATSON WESTERN HILLS WILLIAMS WILSON WOODRUFF TOTAL 71 18 18 36 55 34 54 36 18 34 720 K 54 62 90 52 59 36 31 74 39 40 67 60 89 59 72 74 32 56 59 40 1984 1-12 231 308 451 308 314 215 198 275 267 193 279 228 426 275 417 335 223 402 236 208 9979 TOT 285 370 612 378 373 251 247 349 306 269 401 322 515 334 543 445 255 458 313 282 12683 TOT-P/K 285 370 541 360 373 251 229 349 306 233 346 288 515 334 489 409 255 458 295 248 11963 BL 147 146 336 278 213 198 240 164 173 261 245 211 238 282 332 420 191 233 278 225 8573 WH 127 218 253 95 134 52 5 178 127 6 148 73 238 28 143 19 61 209 27 54 3566 OTH 11 6 23 5 26 1 2 7 6 2 8 38 39 24 68 6 3 16 8 3 544 TOT 285 370 612 378 373 251 247 349 306 269 401 322 515 334 543 445 255 458 313 282 12683 % BL 52% 39% 55% 74% 57% 79% 97% 47% 57% 97% 61% 66% 46% 84% 61% 94% 75% 51% 89% 80% 68% % WH 45% 59% 41% 25%' 36% 21% 2% 51% 42% 2% 37% 23% 46% 8% 26% 4% 24% 46% 9% 19% 28% % OTH 4% 2% W 1% 7% 0% 1% 2% 2% 1% 2% 12% 8% 7% 13% 1% 1% 3% 3% 1% 4% TOTAL F.T.E. 42.40 38.13 76.50 42.90 39.10 28.60 38.00 33.00 34.70 36.20 78.90 40.00 46.60 36.67 77.60 41.75 27.90 50.10 36.90 33.40 1,539.65 TEACH F.T.E. 27.00 23.93 41.00 24.00 22.90 15.50 19.30 20.00 18.70 17.80 32.50 23.50 29.40 21.50 43.60 25.00 15.10 31.50 20.10 18.60 865.33 PUP-P/K / STAFF 6.72 9.70 7.07 8.39 9.54 8.78 6.03 10.58 8.82 6.44 4.39 7.20 11.05 9.11 6.30 9.80 9.14 9.14 7.99 7.43 7.77 PUP-P/K /TEACH 10.56 15.46 13.20 15.00 16.29 16.19 11.87 17.45 16.36 13.09 10.65 12.26 17.52 15.53 11.22 16.36 16.89 14.54 14.68 13.33 13.82 ALTERNATIVE SETTINGS 1 443 444 444 317 121 6 444 71% 27% 1% GRAND TOTAL 720 1985 22485 25190 24470 17097 7154 939 25190 68% 28% 4% 2,728.70 1,706.53 28.04 42.53School Name CENTRAL FAIR HALL McClellan PARKVIEW CLOVERDALE DUNBAR FOREST HEIGHTS HENDERSON MABELVALE MANN PULASKI HEIGHTS SOUTHWEST BADGETT BALE BASELINE BOOKER BRADY CARVER CHICOT CLOVERDALE DODD FAIR PARK FOREST PARK FRANKLIN FULBRIGHT GARLAND GEYER SPRINGS GIBBS JEFFERSON KING MABELVALE MCDERMOTT MEADOWCLIFF MITCHELL OTTER CREEK PULASKI HEIGHT RIGHTSELL ROCKEFELLER Data for Equitable Allocation of Resources Worksheet 1998-99 School Year School# Level Teach/Pupil Staff/Pupil Sq. Ft. Per % Ma % Nev/ Teachers Enrollment Computer Money Volunteer Donate Score % Black Students 1 8 2 12 5 15 7 9 13 16 3 10 11 19 17 22 6 18 21 28 31 32 23 24 25 48 26 37 27 30 35 46 20 33 34 50 38 39 36 1 1 1 1 1 2 2 2 2 2 2 2 2 3 3 3 3 3 3 3 3 3 3 3 3 3 3 3 3 3 3 3 3 3 3 3 3 3 3 18.52 14.23 12.60 14.19 15.34 13.88 15.80 12.63 13.58 12.08 14.72 13.62 12.03 13.20 14.03 15.40 13.42 17.44 15.20 17.07 19.59 12.95 15.25 18.70 10.74 17.19 11.61 16.73 12.29 18.93 17.68 16.36 17.73 17.95 10.23 19.76 20.26 11.00 10.70 12.54 9.18 8.32 9.53 10.21 9.73 10.98 8.77 9.41 8.25 10.48 9.99 8.50 7.14 7.75 7.80 9.37 9.78 9.33 8.48 11.59 7.47 7.85 11.32 5.30 9.54 5.35 8.26 7.72 11.66 8.36 9.63 11.02 10.18 5.07 10.90 11.84 5.85 4.41 143.84 174.75 192.84 138.05 182.74 131.67 128.92 108.47 142.56 122.60 131.72 95.46 162.68 100.45 92.89 156.21 124.84 97.47 103.52 111.15 64.97 208.54 116.40 74.22 147.63 135.14 142.55 132.22 119.73 84.88 113.98 136.53 100.67 111.24 161.98 111.44 125.54 151.12 159.41 52.00 52.00 48.00 41.00 55.00 29.00 44.00 42.00 35.00 29.00 48.00 37.00 42.00 46.00 55.00 53.00 48.00 67.00 42.00 44.00 49.00 47.00 63.00 44.00 26.00 48.00 17.00 53.00 40.00 68.00 40.00 23.00 31.00 54.00 25.00 59.00 47.00 39.00 29.00 15.00 12.00 18.00 14.00 10.00 4.00 16.00 10.00 7.00 ' 14.00 14.00 15.00 14.00 19.00 21.00 39.00 10.00 8.00 11.00 8.00 9.00 .00 20.00 5.00 5.00 6.00 20.00 17.00 4.00 9.00 9.00 7.00 15.00 12.00 31.00 4.00 11.00 13.00 18.00 1855 757 790 935 911 622 771 648 724 506 858 767 510 233 362 323 597 372 596 537 512 224 248 430 464 495 271 316 311 513 658 407 477 332 242 328 464 249 405 .0383 .0740 .0949 .2963 .1087 .0354 .0350 .0818 .2403 .0692 .0536 .0391 .0529 .0149 .1009 .0104 .0737 .1102 .0570 .2769 .0840 .0580 .0047 .0465 .1556 .0303 .0356 .0819 .2605 .0468 .0034 .0972 .0252 .0120 .0670 .0152 .0797 .1212 .2472 59.34 57.73 55.58 120.94 262.20 39.58 74.56 54.05 114.14 54.98 278.19 52.40 54.47 68.07 74.93 77.89 212.17 69.33 243.28 107.68 69.35 66.18 82.12 59.90 252.18 62.30 245.87 84.64 294.14 62.29 64.58 71.21 60.43 61.34 283.47 65.98 58.69 257.44 533.19 3.64 6.20 1.87 4.85 1.40 .00 4.98 1.67 1.40 2.01 22.48 5.42 .96 .58 5.88 11.87 6.10 2.24 32.03 2.49 .57 5.70 5.41 14.89 3.93 15.37 4.90 18.08 44.87 5.47 12.17 .29 6.02 1.43 4.19 14.77 6.74 20.49 17.99 4.84 1.19 6.76 .43 3.79 .00 .00 .00 1.52 1.81 .87 10.26 .12 .00 9.32 4.80 .00 8.69 .00 3.98 .00 .00 1.01 24.98 16.38 .11 .37 5.34 1.61 .63 .23 5.88 27.20 13.25 53.72 10.37 7.28 33.77 3.33 37 49 47 46 47 36 36 40 44 45 46 39 42 41 50 50 43 48 45 47 31 57 44 42 54 45 46 49 60 41 36 41 39 41 56 45 39 60 59 59 81 71 84 51 89 57 70 86 75 52 57 84 92 73 83 52 63 52 69 92 65 76 48 92 48 93 75 52 44 54 73 57 79 92 46 55 94 59 2/11/00 1Data for Equitable Allocation of Resources Worksheet 1998-99 School Year ROMINE TERRY WAKEFIELD WASHINGTON WATSON WESTERN HILLS WILLIAMS WILSON WOODRUFF 40 47 51 42 52 29 43 44 45 3 3 3 3 3 3 3 3 3 12.70 18.12 18.20 13.03 17.64 18.42 15.40 14.89 14.04 7.47 10.83 10.26 7.58 10.45 10.75 9.16 8.98 7.72 129.01 88.67 100.25 136.06 109.22 64.64 98.54 102.42 133.80 40.00 29.00 71.00 34.00 39.00 52.00 63.00 76.00 30.00 14.00 6.00 11.00 7.00 13.00 .00 11.00 4.00 27.00 328 511 373 660 493 315 479 362 284 .0411 .0196 .0080 .0577 .1466 .0984 .0898 .0930 .0200 200.61 57.21 58.73 92.63 77.43 67.20 237.38 60.03 85.65 12.56 10.73 1.21 4.09 4.60 5.63 19.48 .34 3.93 9.56 .00 8.81 1.12 2.55 .00 .00 3.57 .00 52 34 42 43 43 43 47 50 41 63 46 86 53 89 70 52 82 71 2/11/00 21999-00 (DRAFT 2/7/00) Relationship Between Total Scores and Percent of African-American Students Correlations Total Score: 1999 Pearson Correlation Total Score: 1999 1.000 Percent of African-Americ an Students: 1999 -.046 05 CD CD {Z> c CD n 55 c cn o e < c cn o < o c <u a D. Sig. (2-tailed) N .758 48 48 Percent of African-American Students: 1999 Pearson Correlation Sig. (2-tailed) 100 90 80 70 60 50 40 30 20 30 40 50 -.046 1.000 .758 48 48 60 70 Total Score: 1999 N a o 8 o a a a Q o o 0 o o1998-99 (DRAFT 2/7/00) Relationship Between Total Scores and Percent of African American Students Correlations Total Score: 1998 Pearson Correlation Total Score: 1998 ToSo Percent of African-Americ an Students: 1998 .158 Sig. (2-tailed) N .285 48 48 Percent of African-American Students: 1998 Pearson Correlation Sig. (2-tailed) N .158 .285 48 1.000 48 100 co o 90 a (Z> c CD D 55 c CD O O E < c CD O 80 70 a 8 60. < o c CD a CD CL 50 40 30 0 8 o 40 Total Score: 1998 8 50 60 70 }Composite School Scores (1998-99) 22- 23- 24- 25- 26- n- 28- 2)- 30- 31- Cloverdale 32- 33- 34- Terry 35- 36- Dunbar, Cloverdale MS, King 37- Central 38- 39- Pulaski Heights MS, McDermott, Pulaski Heights 40- Forest Heights MS 41- Badgett, Jefferson, Mabelvale, Meadowcliff, Woodruff 42- Southwest, Forest Park, Wakefield 43- Booker, Washington, Watson, Western Hills 44- Henderson, Fair Park 45- Mabelvale MS, Carver, Fulbright, Otter Creek 46- McClellan, Mann, Garland 47- Hall, Parkview, Chicot, Williams 48- Brady 49- JA Fair, Geyer Springs 50- Bale, Baseline, Wilson 51- 52- Romine 53- 54- Franklin 55- 56- Mitchell 57- Dodd 58- 59- Rockefeller 60- Gibbs, Rightsell DRAFT 2/7/00 Composite School Scores (1999-00) n- 23- Forest Heights MS 24- 25- Cloverdale MS, Hall 26- n- 28- 29- Central 30- 31-Terry 32- 33- 34- Mabelvale MS, JA Fair 35- Cloverdale, Otter Creek 36- McClellan, Pulaski HeightsMS, Mabelvale 37- Meadowcliff 38- Dunbar, Watson 39- Chicot 40- Forest Park, Wakefield 41- Wilson, 42- Woodruff, Geyer Springs 43- Brady, Fulbright 44- Parkview 45- Southwest, Badgett 46- Mann, King 47- Carver, Jefferson, McDermott 48- '49- Franklin 50- Garland, Washington -51-Mitchell 52- -53- Williams 54- 55- Western Hills, Romine 56- Henderson 57- Baseline, Booker./' 58- Bale, -59- Rightsell 60- Fair Park, 61- Pulaski Heights - 62- Gibbs 63- 64- ' 65- Rockefeller 66- 67- 69- DoddEquitable Allocation Worksheet: Individual and Total Scores 98 V. 99 High Schools Central Hall JA Fair McClellan Parkview Teacher/Pupil ratio Staff/Pupil ratio Square feet per pupil Percent of staff with masters, plus, nine years of experience Percent of new teachers School size Computer/pupil ratio Per pupil expenditure Volunteer hours per pupil Donations per pupil 1998-99 3 1 6 5 4 2 4 3 4 5 1999-00 1 1 4 5 4 2 3 1 2 6 1998-99 6 5 8 5 3 4 5 3 3 5 1999-00 3 1 2 3 1 3 4 1 3 4 1998-99 5 5 7 5 4 6 5 3 5 4 1999-00 4 2 6 4 2 6 4 2 2 2 1998-99 5 4 5 4 4 3 8 5 4 4 1999-00 2 1 1 3 1 4 8 1 3 6 1998-99 5 4 7 6 5 4 2 6 3 5 1999-00 3 1 6 1 4 5 6 7 3 2 Total 37 29 47 25 49 34 46 36 47 44 DRAFT COPY 2/7/00 1Middle Schools Dunbar Equitable Allocation Worksheet: Individual and Total Scores 98 V. 99 Forest Heights Pulaski Heights Southwest Henderson Teacher/Pupil ratio Staff/Pupil ratio Square feet per pupil Percent of staff with masters, plus, nine years of experience Percent of new teachers School size Computer/pupil ratio Per pupil expenditure Volunteer hours per pupil Donations per pupil 1998-99 4 3 5 1999-00 5 2 5 1998-99 6 5 4 1999-00 5 3 1 1998-99 5 4 3 1999-00 5 2 1 1998-99 6 5 6 1999-00 8 7 8 1998-99 5 4 5 1999-00 8 6 8 Total DRAFT COPY 4 3 2 4 5 4 2 36 3 2 4 2 5 5 5 4 5 4 5 2 3 2 2 2 3 3 1 1 2 4 4 3 4 1 5 6 5 3 3 3 1 6 7 4 4 5 4 2 3 3 2 3 6 5 2 2 2 3 6 3 6 5 3 4 3 2 5 8 7 4 5 38 40 23 39 36 42 45 44 56 2/7/00 2Equitable Allocation Worksheet
Individual and Total Scores 98 V. 99 Middle Schools Cloverdale Mabelvale Mann Teacher/Pupil ratio Staff/Pupil ratio Square feet per pupil Percent of staff with masters, plus, nine years of experience Percent of new teachers School size Computer/pupil ratio Per pupil expenditure Volunteer hours per pupil Donations per pupil 1998-99 5 4 5 3 1 4 4 1 1 2 1999-00 5 2 3 2 1 4 3 1 2 2 1998-99 6 5 4 3 4 6 5 3 4 5 1999-00 7 5 4 3 2 5 4 1 1 2 1998-99 5 3 5 5 4 2 4 7 1 4 1999-00 4 2 5 6 5 2 4 8 3 1 Total 36 25 45 34 46 46 DRAFT COPY 2/7/00 3Equitable Allocation Worksheet: Individual and Total Scores ton Wi 98 V. 99 Elementary Schools Badgett Bale Baseline Booker Teacher/Pupil ratio Staff/Pupil ratio Square feet per pupil Percent of staff with masters, plus, nine years of experience Percent of new teachers School size Computer/pupil ratio Per pupil expenditure Volunteer hours per pupil Donations per pupil Total DRAFT COPY 1998-99 5 6 3 1999-00 4 6 3 1998-99 5 6 3 1999-00 7 7 2 1998-99 5 5 6 1999-00 6 7 8 1998-99 5 4 4 1999-00 8 5 6 Brady 1998-99 4 4 3 1999-00 5 5 2 5 3 8 2 4 3 2 41 1 5 8 2 4 4 2 45 6 2 6 6 5 5 6 50 1 8 6 7 5 4 5 6 1 6 6 5 5 5 6 6 6 1 5 1 5 5 5 2 5 6 5 2 5 4 1 7 8 6 7 7 5 5 6 4 4 6 5 7 4 6 4 3 2 58 50 57 43 57 48 43 2/7/00 4Equitable Allocation Worksheet: Individual and Total Scores 98 V. 99 Elementary Schools Carver Teacher/Pupil ratio Staff/Pupil ratio Square feet per pupil Percent of staff with masters, plus, nine years of experience Percent of new teachers School size Computer/pupil ratio Per pupil expenditure Volunteer hours per pupil Donations per pupil Total DRAFT COPY 1998-99 5 4 4 1999-00 5 5 3 1998-99 4 5 4 Chicot 1999-00 1 4 3 Cloverdale 1998-99 2 2 1 1999-00 3 4 1 Dodd 1998-99 6 6 8 1999-00 8 8 8 Fair Park 1998-99 5 5 4 1999-00 6 7 5 4 5 3 4 6 8 2 45 3 6 1 7 1 8 2 47 4 5 3 8 5 4 5 47 4 4 2 8 6 3 4 39 5 5 3 5 4 2 2 31 2/7/00 3 8 3 5 4 2 2 35 5 9 8 4 4 5 2 57 4 8 8 6 5. 6 8 6 3 6 1 5 4 8 8 8 1 6 5 6 69 44 60 5Equitable Allocation Worksheet: Individual and Total Scores 98 V. 99 Elementary Schools Forest Park Franklin Teacher/Pupil ratio Staff/Pupil ratio Square feet per pupil Percent of staff with masters, plus, nine years of experience Percent of new teachers School size Computer/pupil ratio Per pupil expenditure Volunteer hours per pupil Donations per pupil Total DRAFT COPY 1998-99 3 3 2 1999-00 4 4 1 1998-99 1 1 6 1999-00 7 8 6 Fulbright 1998-99 4 4 5 1999-00 2 4 7 Garland 1998-99 6 7 5 1999-00 6 8 6 Geyer Springs 1998-99 4 5 5 1999-00 1 5 4 4 6 4 4 3 6 7 42 2 1 5 4 3 8 8 40 2 6 4 6 6 4 6 54 1 5 2 1 6 4 3 49 5 6 4 3 4 6 4 6 1 3 2 3 1 8 1 3 6 4 6 4 4 1 3 7 3 7 4 5 6 3 5 5 5 6 5 7 1 5 5 5 5 4 45 43 46 50 49 42 2/7/00 6Equitable Allocation Worksheet: Individual and Total Scores 98 V. 99 Elementary Schools Gibbs Jefferson King Mabelvale McDermott Teacher/Pupil ratio Staff/Pupil ratio Square feet per pupil Percent of staff with masters, plus, nine years of experience Percent of new teachers School size Computer/pupil ratio Per pupil expenditure Volunteer hours per pupil Donations per pupil 1998-99 6 6 4 4 1 6 7 8 8 4 1999-00 8 7 5 6 4 6 8 8 8 2 1998-99 2 2 5 1 5 3 4 4 5 4 1999-00 3 3 3 8 5 4 6 3 8 4 1998-99 3 5 4 4 5 1 1 4 6 3 1999-00 6 6 4 4 1 1 1 4 6 1 1998-99 4 4 5 1 6 4 6 5 1 5 1999-00 3 5 7 1 4 3 5 3 1 4 1998-99 3 3 3 3 4 4 3 4 5 7 1999-00 2 3 4 5 8 4 2 4 8 7 Total 60 62 41 47 36 46 41 36 39 47 DRAFT COPY 2/7/00 7Equitable Allocation Worksheet: Individual and Total Scores 98 V. 99 Elementary Schools Meadowcliff Mitchell Otter Creek Pulaski Heights Rightsell Teacher/Pupil ratio Staff/Pupil ratio Square feet per pupil Percent of staff with masters, plus, nine years of experience Percent of new teachers School size Computer/pupil ratio Per pupil expenditure Volunteer hours per pupil Donations per pupil Total DRAFT COPY 1998-99 3 4 4 1999-00 2 4 7 1998-99 8 8 6 1999-00 7 8 1 1998-99 1 3 4 1999-00 1 1 2 1998-99 1 1 5 1999-00 2 4 8 1998-99 7 6 6 1999-00 6 7 6 6 4 5 2 4 3 6 41 4 6 7 1 2 2 2 37 2 1 1 5 7 4 8 56 1 2 8 3 8 5 2 6 7 5 3 4 6 6 6 6 4 2 2 6 5 5 5 4 5 3 5 5 8 8 6 7 3 1 8 4 4 6 6 6 7 8 1 3 7 1 1 1 2 51 45 35 39 61 60 59 2/7/00 8Equitable Allocation Worksheet
Individual and Total Scores 98 V. 99 Elementary Schools Rockefeller Romine Teacher/Pupil ratio Staff/Pupil ratio Square feet per pupil Percent of staff with masters, plus, nine years of experience Percent of new teachers School size Computer/pupil ratio Per pupil expenditure Volunteer hours per pupil Donations per pupil Total DRAFT COPY 1998-99 8 8 6 1999-00 8 8 7 1998-99 6 6 5 1999-00 7 6 5 Terry 1998-99 3 3 3 1999-00 1 1 1 Wakefield 1998-99 3 4 3 1999-00 3 3 2 Washington 1998-99 5 6 5 1999-00 7 8 8 3 3 4 7 8 6 6 59 2 1 3 8 8 8 6 65 4 4 5 4 6 6 6 52 4 5 5 5 6 6 6 55 3 6 3 3 3 5 2 34 2/7/00 2 7 2 2 2 7 6 31 8 5 5 2 3 3 6 8 6 5 1 4 1 1 3 6 1 4 5 4 4 2 6 1 6 5 2 42 40 43 50 9Equitable Allocation Worksheet: Individual and Total Scores 98 V. 99 Elementary Schools Watson Western Hills Williams Wilson Woodruff Teacher/Pupil ratio Staff/Pupil ratio Square feet per pupil Percent of staff with masters, plus, nine years of experience Percent of new teachers School size Computer/pupil ratio Per pupil expenditure Volunteer hours per pupil Donations per pupil 1998-99 4 3 4 4 4 4 6 5 4 5 1999-00 2 2 4 5 4 3 8 4 2 4 1998-99 3 3 1 5 8 6 6 4 5 2 1999-00 1 3 7 1 8 7 6 3 5 8 1998-99 5 5 3 6 5 4 5 6 6 2 1999-00 4 3 2 8 7 2 4 8 1 8 1998-99 5 5 4 8 1 5 5 4 2 5 1999-00 4 5 3 8 5 5 6 2 1 2 1998-99 5 6 5 3 2 6 3 5 4 2 1999-00 6 6 5 1 4 7 1 6 4 2 Total DRAFT COPY 43 38 43 55 47 2/7/00 53 50 41 41 42 10Composite School Scores (1998-99) 22- 23- 24- 25- 26- 27- 28- 29- 30- 31- Cloverdale 32- 33- 34- Terry 35- 36- Dunbar, Cloverdale MS, King 37- Central 38- 39- Pulaski Heights MS, McDermott, Pulaski Heights 40- Forest Heights MS 41- Badgett, Jefferson, Mabelvale, Meadowcliff, Woodruff 42- Southwest, Forest Park, Wakefield 43- Booker, Washington, Watson, Western Hills 44- Henderson, Fair Park 45- Mabelvale MS, Carver, Fulbright, Otter Creek 46- McClellan, Maim, Garland 47- Hall, Parkview, Chicot, Williams 48- Brady 49- JA Fair, Geyer Springs 50- Bale, Baseline, Wilson 51- 52- Romine 53- 54- Franklin 55- 56- Mitchell 57- Dodd 58- 59- Rockefeller 60- Gibbs, Rightsell DRAFT 2/7/00 Composite School Scores (1999-00) 11- 23- Forest Heights MS 24- 25- Cloverdale MS, Hall 26- 27- 28- 29- Central 30- 31- Terry 32- 33- 34- Mabelvale MS, JA Fair 35- Cloverdale, Otter Creek 36- McClellan, Pulaski HeightsMS, Mabelvale 37- Meadowcliff 38- Dunbar, Watson 39- Chicot 40- Forest Park, Wakefield 41- Wilson, 42- Woodruff, Geyer Springs 43- Brady, Fulbright ' 44- Parkview 45- Southwest, Badgett 46- Mann, King 47- Carver, Jefferson, McDermott 48- 49- Franklin 50- Garland, Washington 51-Mitchell 52- 53- Williams 54- 55- Western Hills, Romine 56- Henderson 57- Baseline, Booker 58- Bale, 59- Rightsell 60- Fair Park, 61- Pulaski Heights 62- Gibbs 63- 64- 65- Rockefeller 66- 67- 69- Doddt * S U.' I (Friryy >----- te' ^Tpi^ LITTLE ROCK SCHOOL DISTRICT 810 WEST MARKHAM LITTLE ROCK, AR 72201 June 8, 1999 TO
Board of Directors FROM: Brady Gadberry, Special Assistant to the Superintendent Junious Babbs, Associate Superintendent, Administrative Services THROUGH: Dr. Leslie Gamine, Superintendent of Schools SUBJECT: Equitable Allocation of Resources The attached documents are presented for e Boards review. No action is required. The first document is a copy of the administrative regulations that were developed to ensure on going compliance with the Revised Desegregation and Education Plan requirement concerning the equitable allocation of resources. The second document is a copy of the court filing the district made as a status report in compliance with Revised Desegregation and Education Plan requirements. LITTLE ROCK SCHOOL DISTRICT NEPN CODE: GCBA-R EQUITABLE ALLOCATION OF RESOURCES The purpose of these regulations is to ensure that the financial, technical, and educational resources of the District are distributed in a fair and equitable manner. A committee comprised of the associate superintendents, the Special Assistant to the Superintendent, the Manager of Financial Services, and a District research specialist in compliance with the Revised Desegregation and Education Plan (Plan) will develop and implement a process for assessing the equitable allocation of resources. Members of the staff of the Office of Desegregation Monitoring, and representatives of the Joshua Intervenors will be invited to assist in the performance of the committees responsibilities. The allocation of resources does not have to be equal. It is probable that there could never be a totally equal distribution. The basis of the allocations must be equitable. The committee will determine which resources should be included in the factors being assessed for equity. Those factors will be analyzed and compared by school to establish District norms and possible standards or parameters to guide in the distribution of those resources. As part of its analysis the committee will determine whether a relationship exists between the resources allocated and the percentage of African-American students attending the schools. If the committee determines that the allocations are outside the acceptable parameters The that it has set, it shall determine what possible remedies are appropriate, implementation of those remedies will be the responsibility of the associate superintendent for the identified division. If budget or policy changes are required to implement appropriate remedies, the Superintendent of Schools will be notified so that action by the Board of Education can be initiated. The committee will serve an oversight function and ensure the following components are in place to assure equitable treatment
1. Compliance standards and procedures reasonably capable of reducing the prospect of noncompliance
2. Oversight of compliance with such standards and procedures by the Superintendent and the responsible officials
3. Communication of compliance standards and procedures to all employees
4. Utilization of monitoring and auditing systems reasonably designed to detect noncompliance
5. Utilization of a reporting system whereby students, patrons, and employees can report complaints or noncompliance without fear of retribution:6. 7. 8. LITTLE ROCK SCHOOL DISTRICT (continuing) NEPNCODE
GCBA-R Enforcement of compliance standards and procedures through disciplinary mechanisms when appropriate, including the discipline of individuals responsible for compliance and individuals responsible for any failure to report noncompliance
and, After noncompliance has been detected, implementation of all reasonable steps to correct past noncompliance and to prevent further noncompliance, including modification of the compliance program as necessary to prevent and detect further similar noncompliance. Annual review of the compliance program for necessary revisions. 2IN THE UNITED STATES DISTRICT COURT* EASTERN DISTRICT OF ARKANSAS , - WESTERN DIVISION I. little rock school district PLAINTIFF V. LR-C-82-866 PULASKI COUNTY SPECIAL SCHOOL DISTRICT NO. 1,ET AL DEFENDANTS MRS. LORENE JOSHUA, ET AL INTERVENORS KATHERINE KNIGHT, ET AL INTERVENORS REPORT OF LRSDS ASSESSMENT OF THE EQUITABLE ALLOCATION OF RESOURCES Plaintiff Little Rock School District (LRSD) for its Report of LRSDs Assessment of the Equitable Allocation of Resources states: 1. LRSDs Revised Desegregation and Education Plan (Revised Plan) requires that LRSD assess the equitable allocation of resources in the district and report the results of this I assessment within 180 days of the district courts approval of the Revised Plan. Revised Plan 2.9.2. The district court approved the Revised Plan on April 10, 1998. Docket No. 3144. Accordingly, LRSDs report of the assessment of the allocation of resources was to be completed on or before October 7, 1998. LRSD files this report in compliance with the Revised Plan. 2. LRSD assessed the allocation of its resources by way of a committee composed of district administrators and staff persons and represenutives of the OfBce of DesegregationMonitoring (ODM).* The committee first worked to determine what resources should be assessed. In this regard, the committee looked to available research in the area of school re
This project was supported in part by a Digitizing Hidden Special Collections and Archives project grant from The Andrew W. Mellon Foundation and Council on Library and Information Resoources.